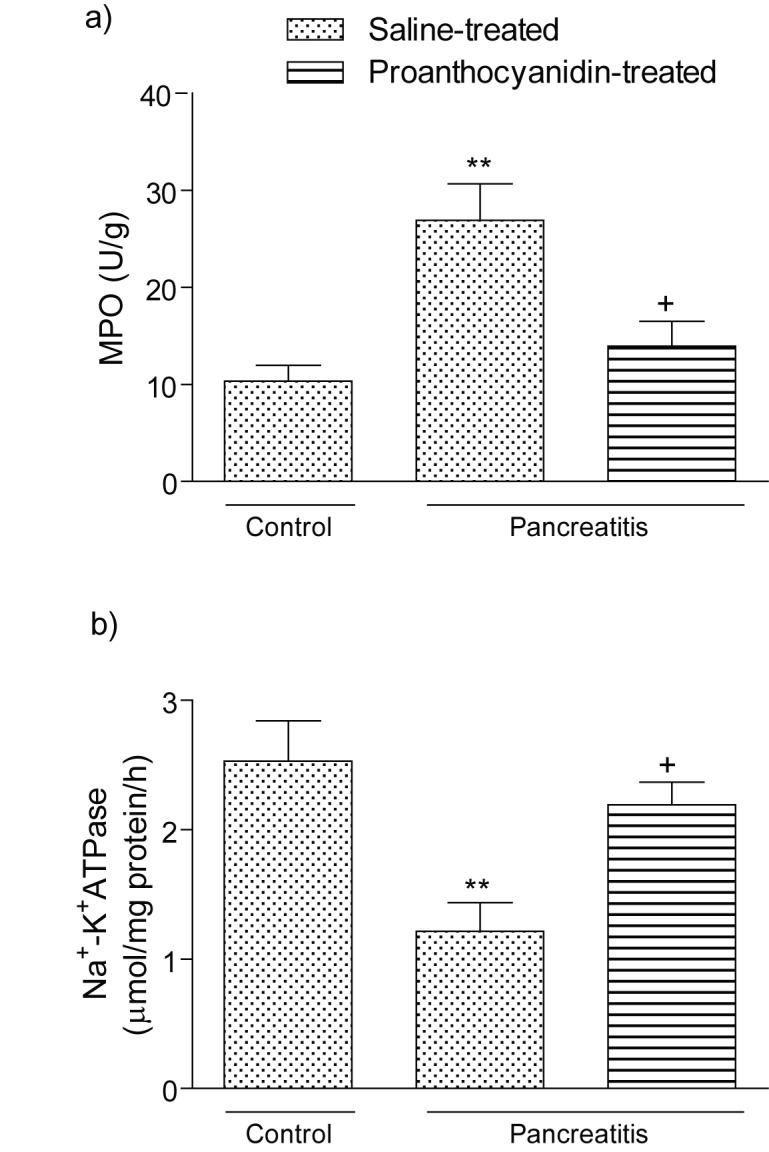
Figure 3.

(a) Myeloperoxidase activity and (b) Na+-K+ ATPase activity in the pancreatic tissues of control, saline-treated pancreatitis and proanthocyanidin-treated pancreatitis groups. Each group consists of 6 animals. **p < 0.01, compared to the control group. +p < 0.05, compared to saline-treated pancreatitis group.
