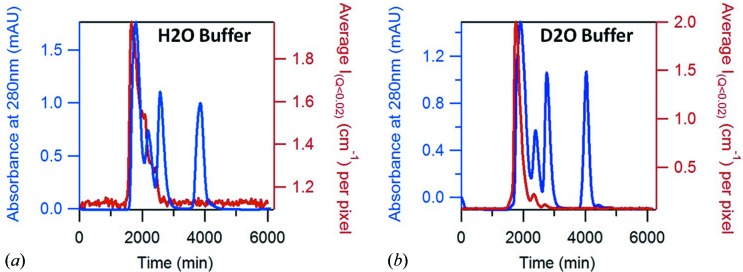
Figure 2.
SEC-SANS measurements of SEC calibration standards eluted with 0% (a) and 100% (b) D2O buffer. The absorbance of the sample at 280 nm is plotted in blue, and the averaged SANS intensity between Q = 0.007 Å−1 and Q = 0.02 Å−1 is in red. The column (Superdex 75) efficiently separates proteins of molecular weight (MW) from 3000 to 70000 Da.

