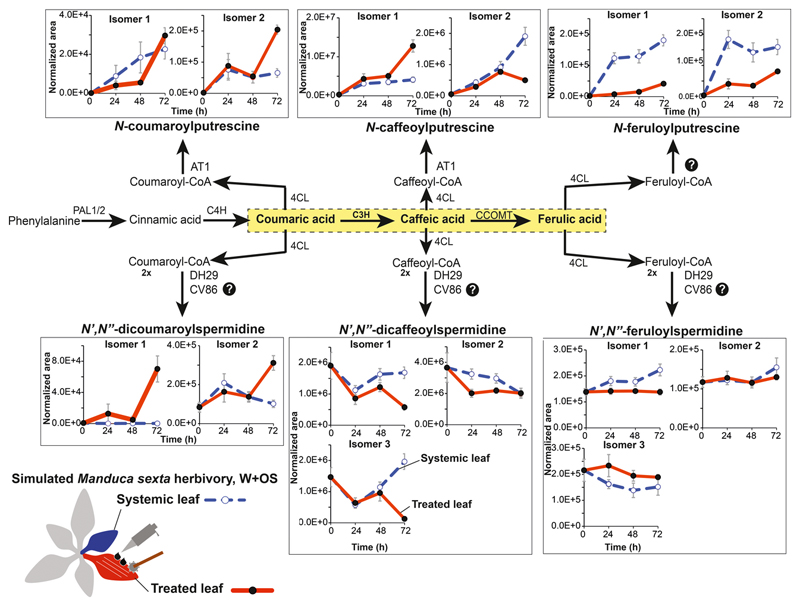
Figure 3. Herbivory-induced changes in N. attenuata leaf phenolamide metabolism.
Gene names and functions are given in the main text. Dark blue lines depict metabolite accumulation patterns in W+OS-treated leaves and red dashed lines depict responses in a systemic leaf from the same plant. Putrescine conjugates show greater induced changes than do spermidine conjugates. Dynamics differ among the predicted isomers.

