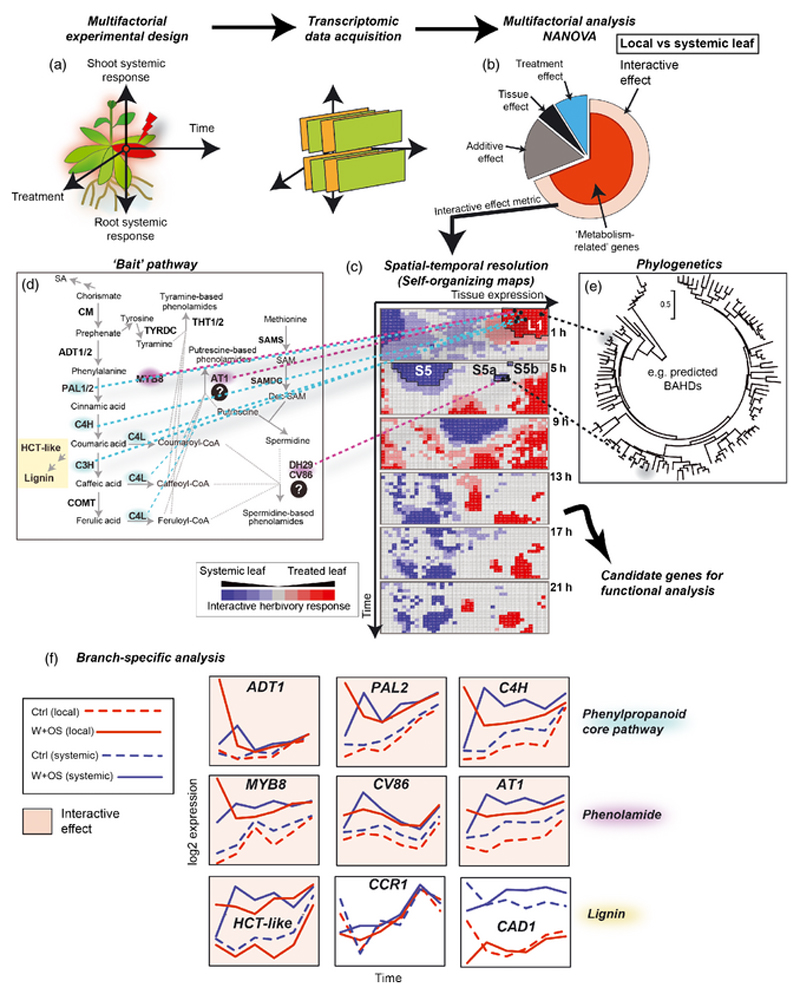
Figure 6. A multifactorial-based coexpression analysis work-flow for delineating systemically-induced secondary metabolic pathways.
A multifactorial analysis work-flow has been developed by Gulati et al. (2013) and its use in delineating genes in the acyclic diterpene glycoside pathway has previously been reported. This strategy is applied to the analysis of multidimensional transcriptomic data-sets acquired from multifactorial experimental designs (different tissue types, treatment, etc…) including time-series experiments (a). Transcriptomic data collected at each time point are combined into a data matrix used for multifactorial analysis. The statistical group corresponding to the interactive effect genes (those genes that respond to the treatment differently according to the tissue type, here locally vs systemically treated leaves) is highly overrepresented with metabolism-related genes (red sector) (b). Self-organizing maps are used to impose structure (c) and to cluster genes within this bin according to their temporal dynamics using a metric derived from the multifactorial analysis. Bait genes (here from the phenylpropanoid and phenolamide pathways) can be localized on the maps to identify clusters of genes of interest (phenylpropanoid genes: L1 for early interactive effects in local leaves; phenolamide genes: L1, S5a and S5b for local and then systemic interactive effects) (d). These clusters of genes can be subsequently mined in accordance with the predictions of phylogenetic relationships (e). (f) Genes from specific branches of the phenylpropanoid space can be classified according to the detection of an interactive effect regulation. Most lignin-related genes, except HCT-Like, do not show interactive effect regulation in response to herbivory, unlike the core phenylpropanoid and phenolamide genes.

