
Figure 1.
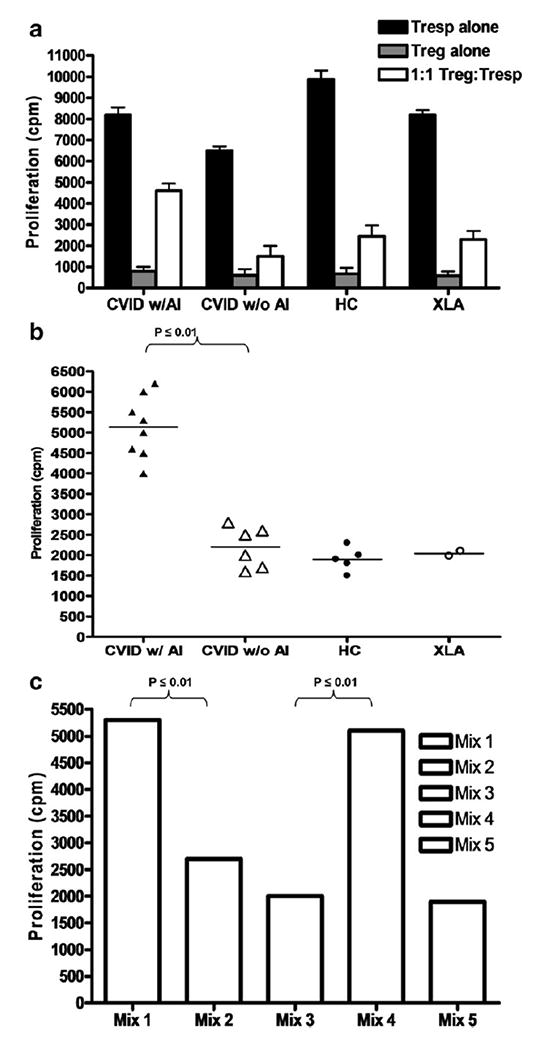
(a) Treg suppression assay in a representative CVID subject with and a representative CVID without autoimmune disease (AI) and representative healthy controls (HC) and representative XLA subject. The x-axis shows responder cells (activated autologous CD4+ effector Tcells) alone in the black bar and natural regulatory T cells alone in the gray bar (shown for confirmation of anergy) which were then mixed at 1:1 ratio as shown in the white bar. The y-axis shows proliferation as measured by uptake of 3H-thymidine (in cpm or counts per minute) The bars represent the standard deviation from the mean. (b) Treg suppression assay results displayed for all subjects (as calculated by autologous Tsuppression assay with Treg:Tresp as a 1:1 ratio) in CVID subjects with and without autoimmune disease compared to healthy controls and XLA subjects. The y-axis shows the numerical quantity of Treg dysfunction as uptake of 3H-thymidine (in cpm or counts per minute). Each dot represents an individual subject. (c) Mixing experiments of Treg and Tresp cells from different patients at 1:1 ratios. Treg derived from CVID w/ AI with Tresp from CVID w/o AI (Mix 1), Treg derived from CVID w/o AI with Tresp from CVID w/ AI (Mix 2), Treg derived from HC with Tresp from CVID w/ AI (Mix 3), Treg derived from CVID w/ AI with Tresp from HC (Mix 4) and Treg derived from XLA with Tresp from HC (Mix 5). A representative pair for each mixing experiment is shown. The y-axis shows the numerical quantity of Treg dysfunction as uptake of 3H-thymidine (in cpm or counts per minute).