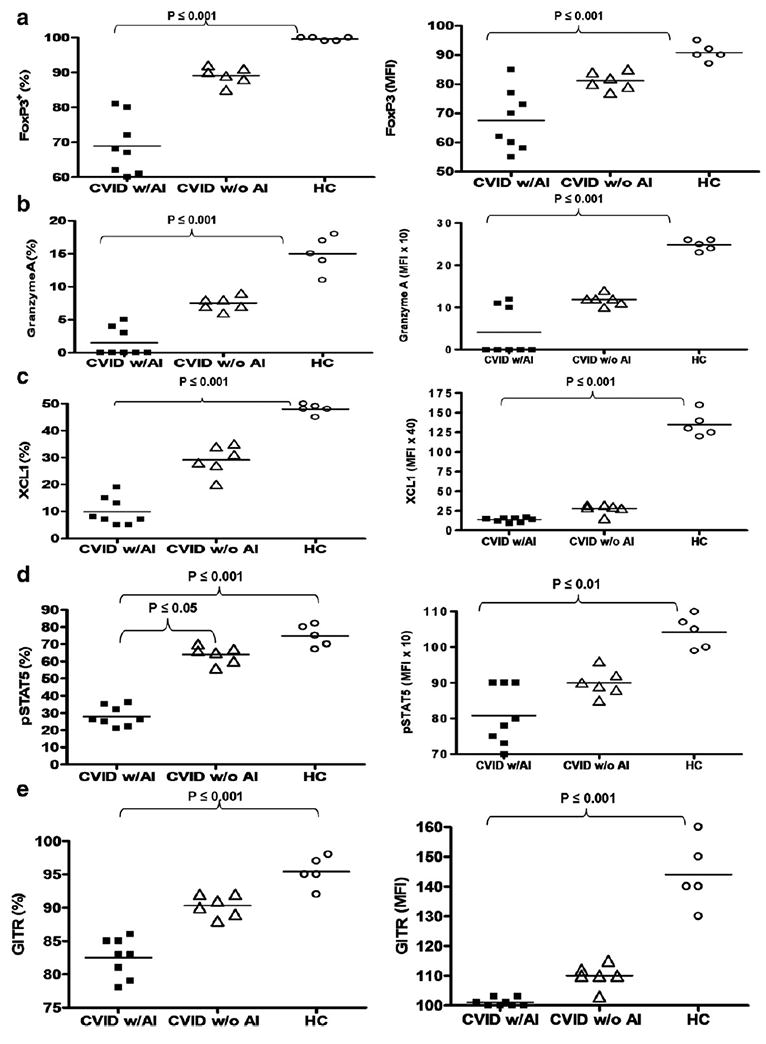
Figure 3.

Percentages and MFI (mean fluorescence intensity) of FoxP3 (a), Granzyme A (b), XCL1 (c), pSTAT5 (d), and GITR (e) in Treg of CVID subjects with and without autoimmune disease and healthy controls. Each dot represents an individual subject. The bar represents the mean value and p values ≤ 0.05 were considered significant (two-tailed).
