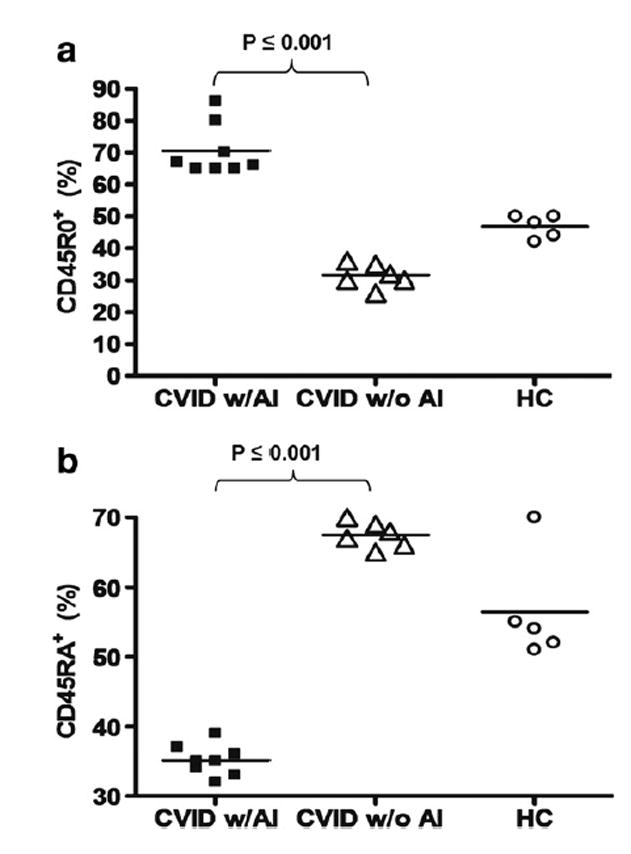
Figure 7.

Percentage of CD45RO+ (a) and CD45RA+ (b) expressing Treg of CVID subjects with autoimmune disease, CVID without autoimmune disease, and healthy controls. Each dot represents an individual subject. The bar represents the mean value and p values ≤ 0.05 were considered significant (two-tailed).
