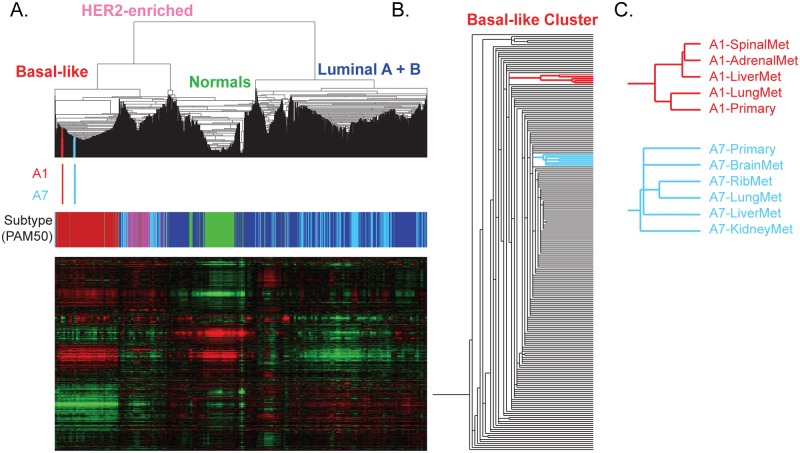
Fig 2. Molecular relatedness of matched primary and metastases.
(A) Hierarchical clustering of patient A1 and A7’s tumors with 1,100 TCGA Primary samples and 98 normal breast samples analyzed using a breast cancer intrinsic gene list. The color bars under the dendrogram indicate (i) where A1 (red) and A7 (blue) specimens are clustered and (ii) the PAM50 subtype of each sample (basal-like, red; HER2-enriched, pink; luminal A, dark blue; luminal B, light blue; and normal-like, green). (B) The position of A1 (red) and the position of A7 (blue) within the basal-like cluster are highlighted. (C) The relationship of the primary and metastases for each patient based upon gene expression patterns.

