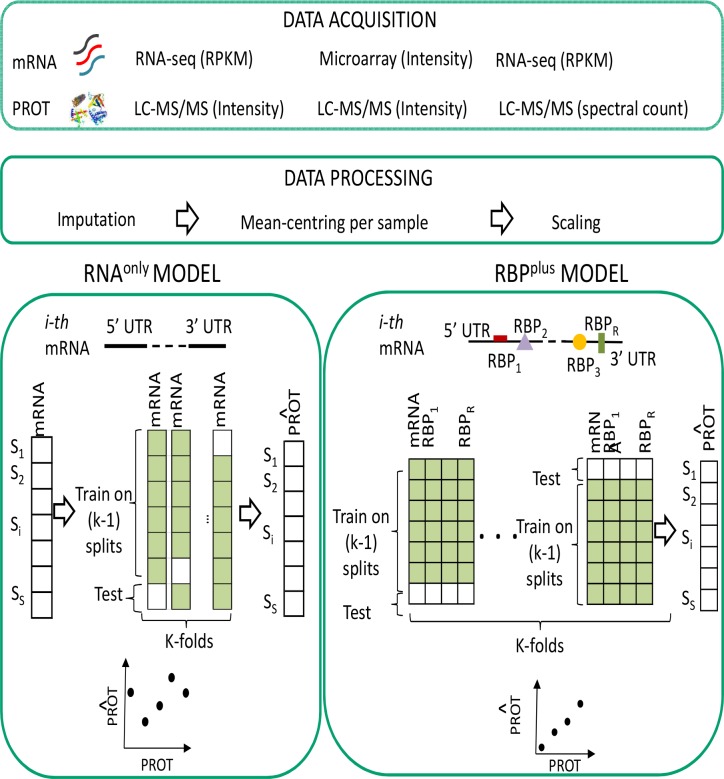
Fig 1. Data modelling workflow.
Primary data consist of three panels of quantitative transcriptome assays matched with proteome assays. Panels differ by cellular state and technological platforms for quantification of transcript and protein abundance. Data modelling is performed in parallel in the three panels. For each mRNA, we compare the accuracy of two models to predict abundance of the corresponding protein: a basic model (RNAonly) that predicts level of the protein from its mRNA level only, and a RBP-inclusive model (RBPplus) containing additional candidate predictors defined by protein levels of the RBPs which were inferred by sequence specificity to bind the mRNA UTRs. Data used in each type of model are visualized with matrices where samples (S) are shown by row and predictors (mRNA, RBP protein levels) by column. Accuracy of predicted protein abundance was assessed by k-fold (k = 5) cross-validation.

