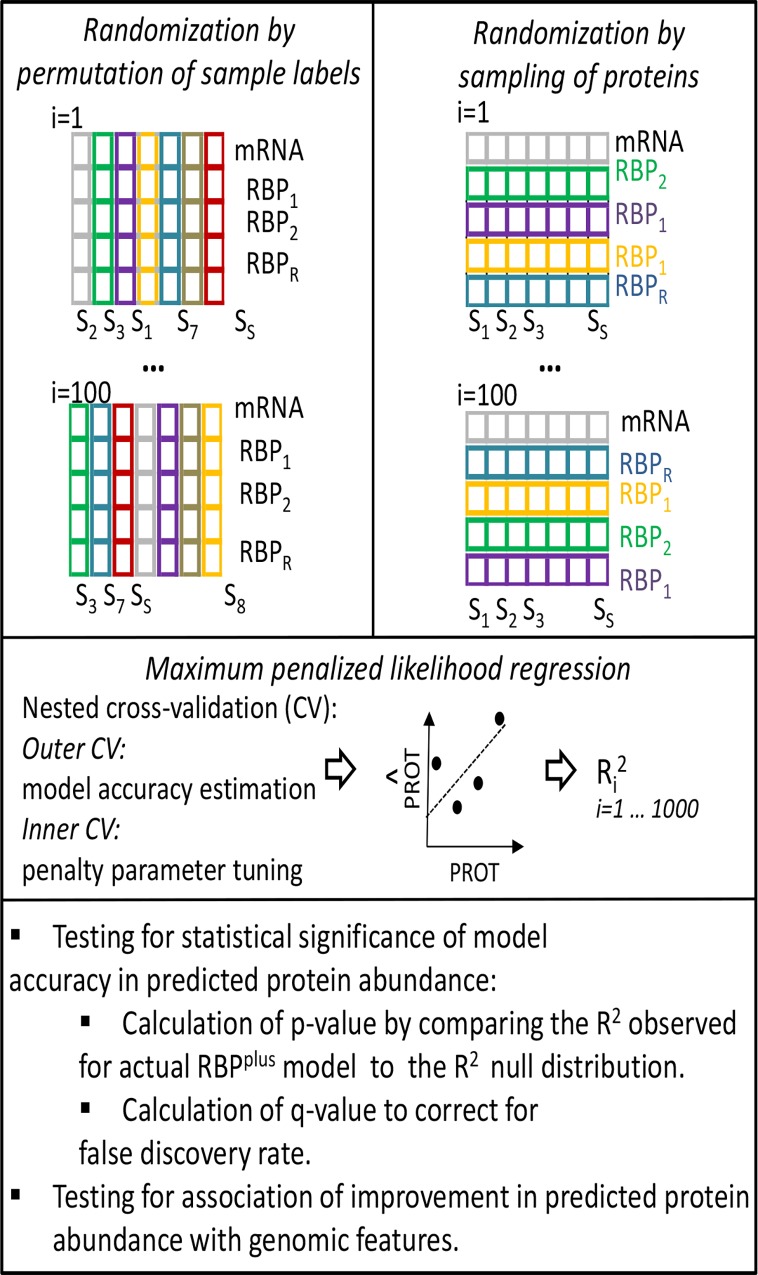
Fig 3. Scheme of tests assessing statistical significance of the accuracy of RBPplus model to predict protein abundance and association of accuracy with genomic features.
For each gene, 1000 randomized versions of the RBPplus model were obtained either by permuting the RBP protein levels across samples (left side), or by randomly sampling a number of protein predictors equal to the number of actual RBPs inferred to bind the mRNA UTRs (right side). The two randomization tests were run in parallel for each gene. Each randomized model was fitted with Ridge penalized linear regression using nested cross-validation (CV). In the nested cross-validation scheme, test samples are held out for accuracy estimation in the outer layer of CV, and penalty parameters are tuned in the inner layer of CV within training samples only. The p-value of the RBPplus model of each gene was defined by the probability of sampling a R2 value from the empirical null distribution higher than the R2 observed for the actual RBPplus model. False Discovery Rate was estimated by Storey’s q-value method.

