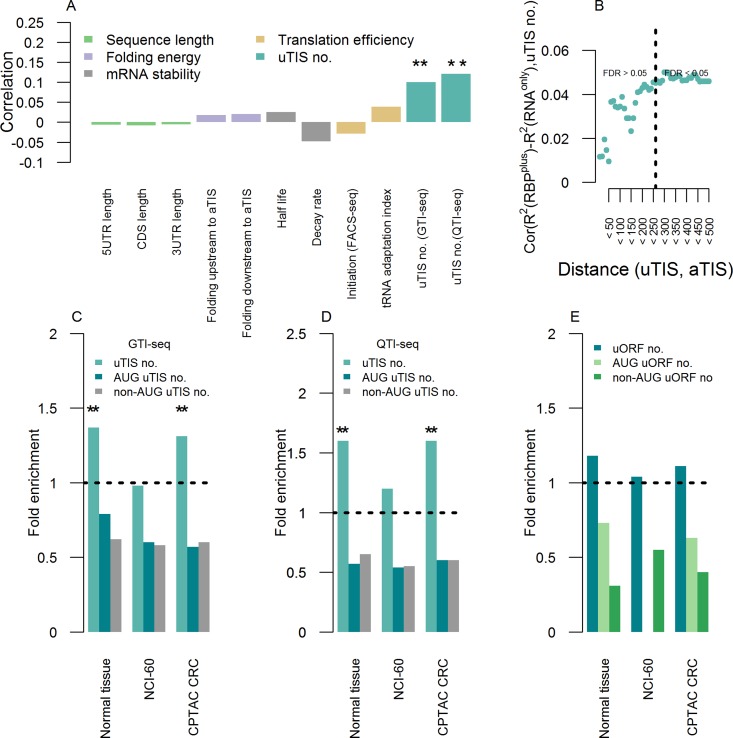
Fig 4. Upstream translation initiation as a prominent feature of the improved predictability of protein levels from transcript levels by RBPplus models.
(A) Spearman’s correlation coefficient of the improvement in accuracy of predicted protein abundance obtained by the RBPplus model relative to the RNAonly one (R2RBPplus—R2RNAonly) with several mRNA features. Different colours denote features pertaining to the length of annotated mRNA UTRs and CDS, mRNA folding, mRNA stability, transòlation efficiency and alternative translation by upstream Translation Initiation Sites (uTISs). Analysis is conducted in the panel of human normal tissues. Stars denote statistical significance of correlation (** stands for p < 0.01). (B) Spearman’s correlation coefficient between improvement in accuracy of predicted protein abundance and number of uTISs localized at increasing distance upstream to the annotated TIS. Dashed line indicates the distance at which correlation becomes statistically significant. (C) uTIS-containing genes are overrepresented in the genes where RBPs improve accuracy of predicted protein abundance relative to the genes where RBPs do not. Shown is the fold enrichment observed for each panel. Stars denote Fisher’s test statistical significance (** stands for p < 0.01). This analysis is based on the uTIS map acquired by GTI-seq in HEK293 cells. (D) Overrepresentation is robust to the technological platform for mapping uTISs (QTI-seq in HEK293 cells). (E) The association between improvement in predictive accuracy and number of uTISs does not depend on uORFs. uORF-containing genes are not overrepresented in the genes where RBPs are informative relative to the genes where RBPs are not.

