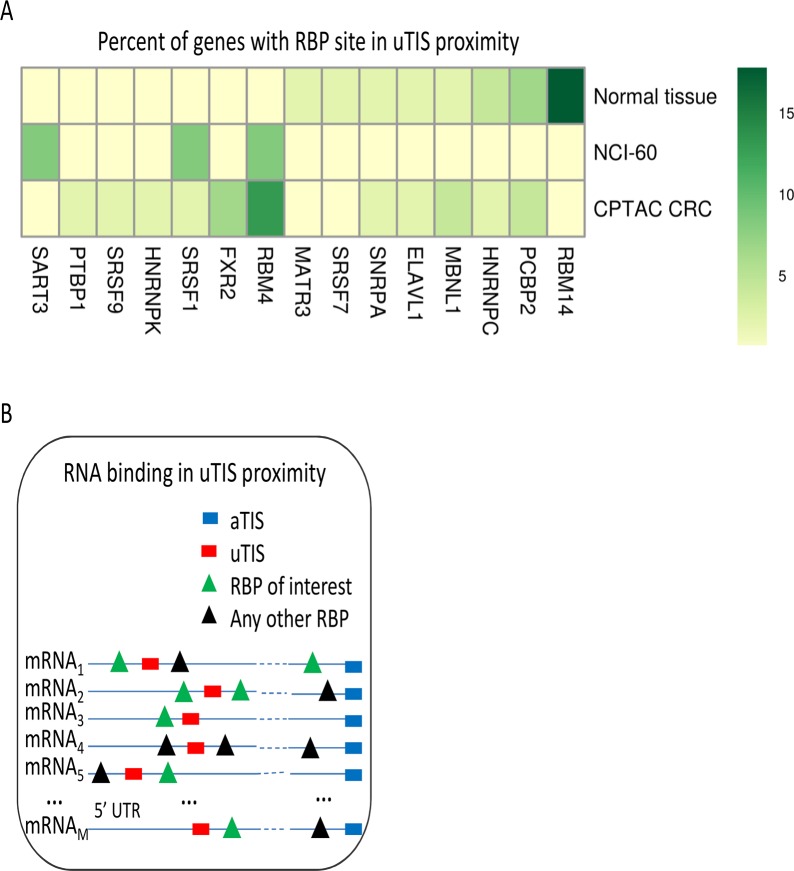
Fig 5. Prioritization of RNA binding proteins.
Candidate RBPs are identified analysing the binding sites of each RBP in the RBP binding sites situated nearest to the uTISs of the mRNAs where the RBPplus model improves accuracy pf predicted protein abundance. (A) The heat map displays the percentages of genes where each RBP showed the minimal distance between a RBP binding site and an uTIS. (B) The inset displays the criterion of minimal distance between RBP binding sites and uTISs used to identify RBPs. RBPs are shown if they resulted to recognize the binding sites closest to the uTISs of mRNAs in at least one of the three panels.

