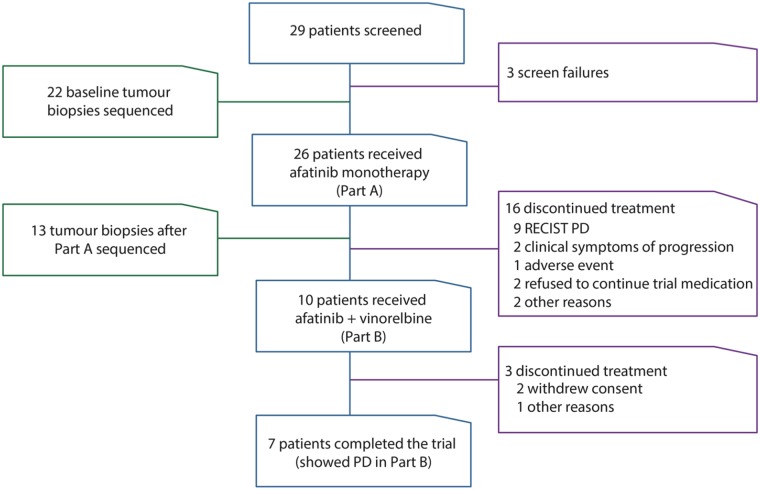
Fig 1. Study flow and patient disposition.
This figure describes the study and number of patients in each part of the clinical trial (blue outline), reasons for patients being excluded or discontinuing treatment (purple outline), and number of patients with genomic analysis performed (green outline). PD, progressive disease.

