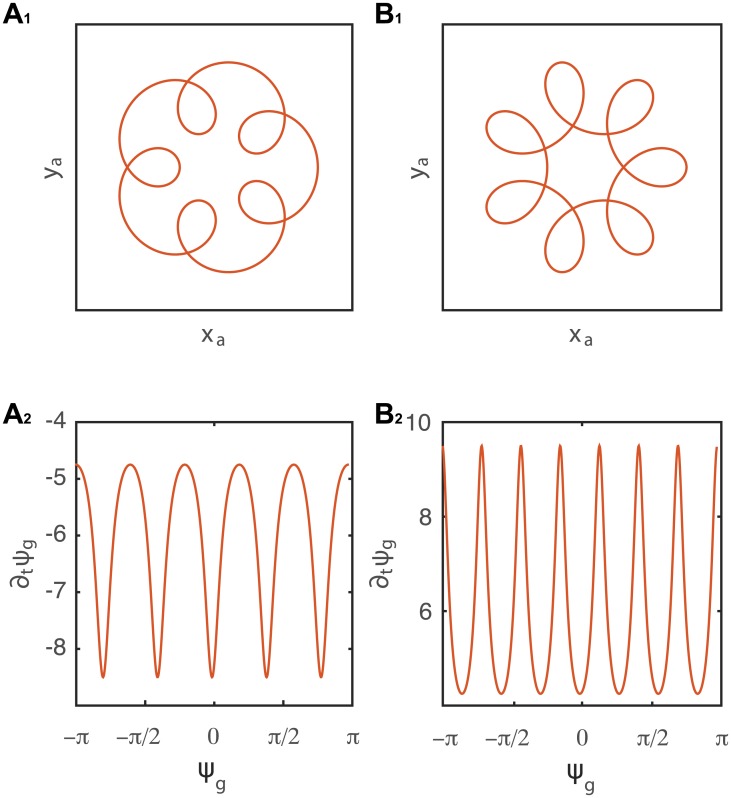
Fig 8. Epi- and hypo-trochoids constructed as a sum of two linear oscillators with angular frequencies respectively ω1 and ω2.
A1 ω2 = 6ω1 and B1 ω2 = −6ω1. Plotting ∂t ψg as a function of time is governed by the oscillator with the higher frequency, in this case ω2 (A2 and B2). Simulations of these patterns are presented in S6, S7 and S8 Videos. The analysis of using Eq 20 does not allow to extract accurately the values of ω1 and ω2, but rather gives and effective oscillator.

