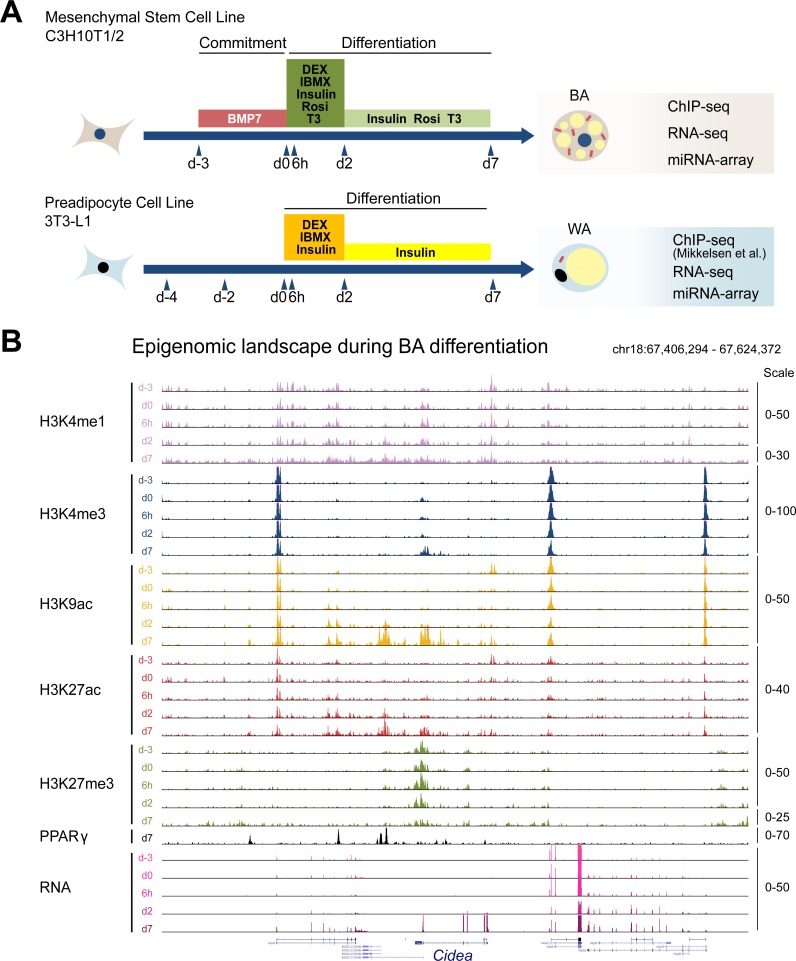
Fig 1. Generation of comprehensive epigenomic and transcriptomic reference maps during brown adipogenesis.
(A) Schematic of the adipogenesis procedures for BA (commitment and differentiation) and WA (differentiation only). (B) Snapshot of the genomic region surrounding the Cidea gene in the UCSC Genome Browser featuring a panel of chromatin marks, PPARγ binding, and mRNA levels during BA differentiation. The scale represents the normalized reads counts. For the H3K4me1 and H3K27me3 d7 tracks, the scale was adjusted to account for lower total ChIP-seq signals. For other loci see S3 Fig.

