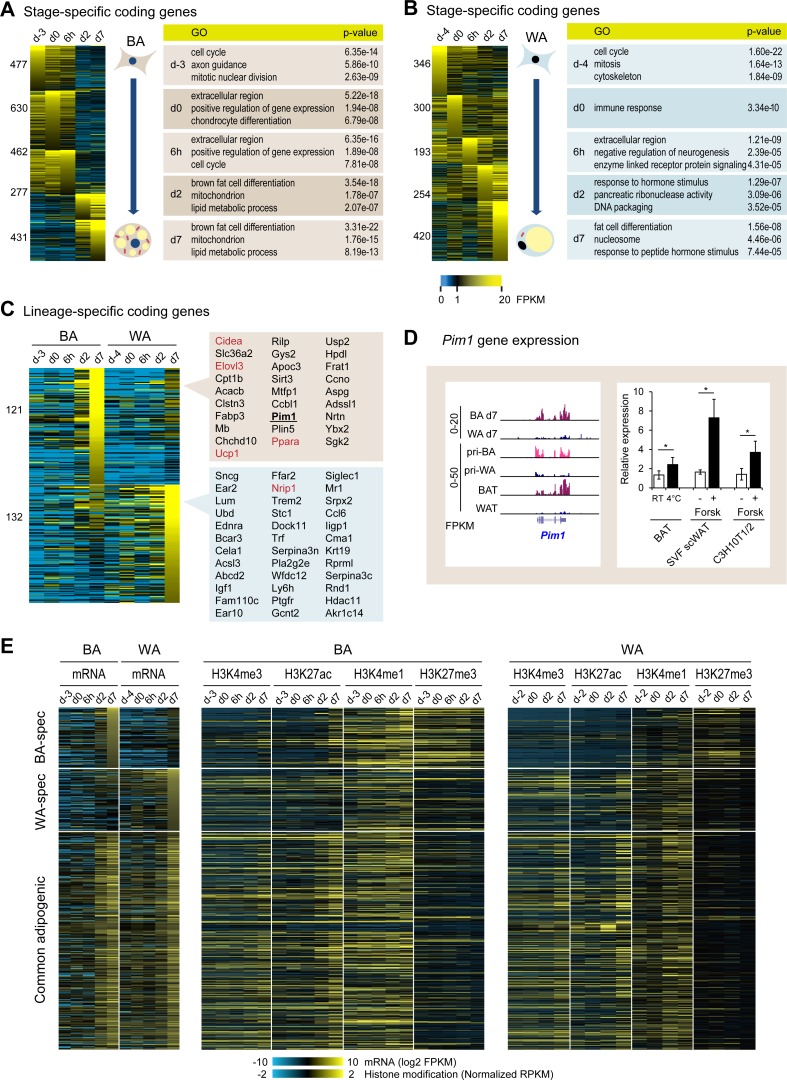
Fig 2. Transcriptomic analysis of BA and WA differentiation.
(A) and (B) Differentiation stage-specifically expressed coding genes during BA and WA differentiation (FPKM > 5). The tables show the top 3 (non-redundant) enriched GO categories at individual stages. See S2 Table for the full list. (C) BA and WA lineage-specific coding genes. The list highlights genes showing consistent lineage specific expression between this dataset and primary cells as well as in vivo tissues. Several established lineage markers are highlighted in red. (D) Pim1 gene expression. Left panel: expression pattern of the Pim1 kinase gene determined via RNA-seq in mature BA and WA, differentiated primary SVF cells derived from BAT (pri-BA) and WAT (pri-WA), as well as brown adipose tissue (BAT) and white adipose tissue (WAT). Right panel: Pim1 expression in BAT tissue isolated from male C57BL/6 mice (BAT); in SVF cells isolated from the posterior subcutaneous WAT and differentiated into adipocytes (SVF scWAT); in C3H10T1/2 cells differentiation into BAs (C3H10T1/2). Mice were housed either at RT or 4°C for 7days before isolation of BAT tissue. n = 3 for each group, error bars indicate standard deviation. p-values (paired student’s t-test): * < 0.05. Cells were treated either with 10μM Forskolin or DMSO for 3h before harvesting. Graphs represent the average of three independent experiments, error bars indicate standard deviation. p-values (paired student’s t-test): * <0.05. (E) Heatmaps showing the expression patterns of BA-specific, WA-specific and common adipogenic genes, as well as the status of chromatin modifications at corresponding promoters throughout the differentiation of BAs and WAs.

