Summary
Previous work suggests that the tooth height to diameter ratio (H/D) may have an influence on the fracture resistance of dog canine teeth. Thus, it can be hypothesized that canine teeth with distal abrasion or teeth already requiring pulpal manipulation may benefit from a reduction in height and that an ideal H/D exists that balances tooth fracture resistance and tooth function. Therefore, a study was performed to investigate the influence of H/D on force to fracture and probability of fracture of canine teeth in dogs. Thirty extracted canine teeth from laboratory Beagle dogs were standardized by hard tissue volume and evenly distributed among three groups; unaltered H/D (group A), 10% reduction in H/D (group B) and 20% reduction in H/D (group C). The teeth were potted in clear auto-polymerizing orthodontic acrylic and then secured within a universal materials testing machine. A displacement was applied at a speed of 1 mm/min to the distoocclusal line angle at 45° angle to the long axis of the crown. The maximum measured force at the time of fracture represented the maximum force to fracture. A linear regression model showed a significant inverse relationship between H/D and force to fracture (p=0.043; 95% CI -55.2 to -0.09). A margin of safety (MoS) analysis was performed to determine the probability of fracture by comparing normal force distributions of the measured force at fracture to that reported in a previous study, representative of normal biting-pulling loads on canine teeth. When 100% of the load was applied to a single unaltered canine tooth the probability of fracture was 36.7%. Decreases in H/D of 10% and 20% resulted in a decreased probability of fracture by 24.1% and 60.4%, respectively. A paired MoS analysis was conducted wherein the applied loads were distributed across two maxillary canine teeth according to their relative heights. Within the pair, a 20% decrease in H/D decreased the probability of fracture of that tooth by 86.5%, but increased the probability of fracture of the unaltered contralateral canine tooth by 54.4%. The results of this study may have implications on the successful long-term management of traumatized canine teeth in dogs. The findings of this study support the hypothesis that teeth with a lower H/D are more resistant to fracture. However, given the potential impact of crown reduction of a single canine tooth on the load redistribution to the remaining unaltered canine teeth, further investigation is needed to determine what H/D would be ideal. In addition, future studies could elucidate in which clinical scenarios the concept of H/D reduction could be implemented.
Introduction
Dental fractures in domestic dogs are common. The prevalence is reported to be as high as 27%.1,2 The canine teeth of dogs, due to the prominent position in the rostral oral cavity, are vulnerable to trauma. In addition, the canines are used for apprehension and defense, which adds to their vulnerability. The most commonly fractured tooth in the dog is the canine tooth with a reported frequency between 35.5% and 57.1%.1,2
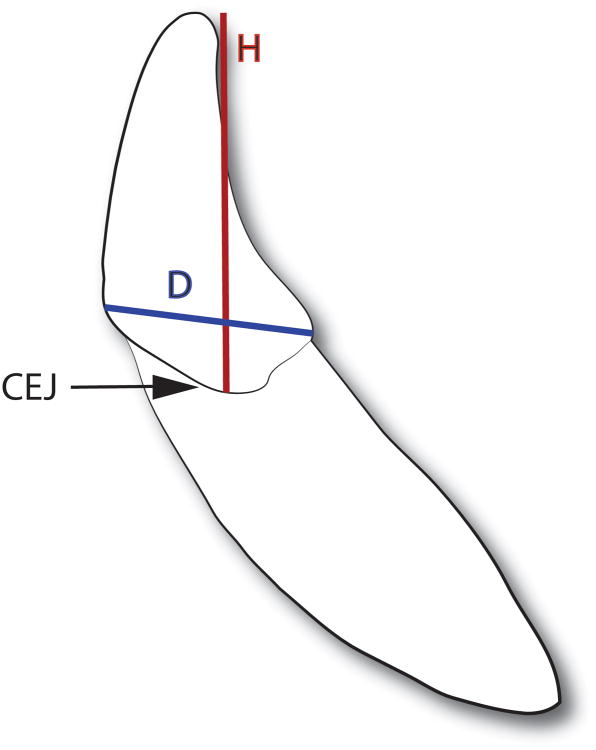
The morphology of the canine tooth, in particular the crown height (H) to base diameter (D) ratio (H/D) (Figure 1), may also contribute to its fracture vulnerability. Previous investigations using beam theory and two- and three-dimensional finite element models have revealed an inverse relationship between tooth height and both tooth strength and fracture resistance in wild carnivores.3-5 Additionally, previous work suggests that a large crown H/D may decrease the fracture resistance of canine teeth in dogs.6
Figure 1.
Illustration of a canine tooth depicting the location of the height (H) and diameter (D) measurements relative to the cementoenamel junction (CEJ).
Due to the naturally high H/D of the canine tooth, when a load is placed near the cusp it is subjected to a significant moment compared to other teeth.7 The large magnitude of the moment placed on the crown may be partly explained with the formula M = F × a, where M=moment, F=force and a=moment arm. The crown height represents the moment arm for a force applied perpendicular to the long axis of the tooth. For a given load applied to the crown, the longer the moment arm (taller the crown), the greater the moment generated at the base of the tooth. This moment is also directly proportional to the bending stress, and the tensile and compressive stresses it produces. In dogs that use the canine teeth to penetrate into objects (e.g., apprehension or Schutzhund training), the forces applied to these teeth are unpredictable in magnitude and direction making these teeth even more susceptible to fracture.7
Thus, it can be hypothesized that clinical reduction of canine tooth H/D may be advantageous in certain clinical scenarios. Specifically, canine teeth with distal abrasion or teeth already requiring pulpal manipulation may benefit from a reduction in height. It can also be hypothesized that an ideal H/D exists that balances tooth fracture resistance with function. However, this concept requires in depth evaluation. Therefore, a study was performed to investigate the influence of H/D on force to fracture and probability of fracture of canine teeth in dogs.
Materials and Methods
Teeth
Mandibular and maxillary canine teeth were surgically extracted from fresh or fresh-frozen canine cadavers that had been euthanized for reasons unrelated to the study. The crowns of the teeth were then examined to ensure that there was no evidence of pre-existing crown trauma or defects. The teeth were stored in 10% formalin8 at room temperature until prepped for mechanical testing.
In order to minimize the variability in the size of the teeth included in this study, the following steps were taken to calculate the hard tissue volume of each tooth crown:
- The crown height and major and minor base diameters were measured utilizing a method previously described.6 The crown height was measured from the cement-enamel junction (CEJ) to the most coronal point of the crown along the facial axial wall. The major (mesial to distal) and minor (facial to lingual) base diameters were measured at the level of the CEJ. (Figure 1)
- The total crown volume was calculated using the formula for a right elliptical cone [V= πab(h/3), where V = volume, a = minor base diameter, b = major base diameter and h = crown height].
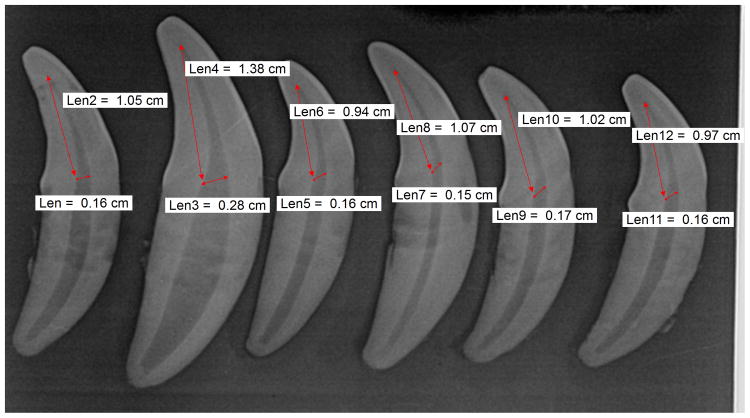
- A lateral radiograph of each tooth was then acquired with an indirect digital radiographic systema. Utilizing the pre-calibrated measurement capabilities of the viewing software, the pulp chamber diameter was measured in the mesial to distal plane at the level of the CEJ and the pulp chamber height was measured from the CEJ to the pulp horn (Figure 2).
- Pulp chamber volume was calculated by utilizing the formula for a cone [V=1/3(πr2h), where V = volume, r = pulp chamber radius and h = pulp chamber height].
- The hard tissue volume for each extracted teeth was calculated by subtracted pulp chamber volume from total crown volume.
Figure 2.
Lateral radiograph of teeth depicting the method utilized to obtain pulp chamber measurements.
The mean hard tissue volume of all extracted teeth was then calculated. The first 30 teeth with a hard tissue volume that fell within ± 20% of the mean hard tissue volume were included in the study. The H/D was then calculated for each tooth included in the study. The 30 testable teeth were split into two groups of 15 based on the median H/D; those below and above the median H/D. Five teeth from the below median group and five teeth from the above median group were randomly assigned to one of three groups (A, B or C) such that each group consisted of ten teeth. Teeth trios were defined by matching teeth in groups B and C to a tooth in group A according to H/D. The H/D of individual teeth in group B was reduced by 10% of the H/D of its pair from group A. In group C, the H/D was reduced by 20% of the H/D of its pair from group A. Crown height reductions were performed with a #699 burr in a high-speed hand piece. The teeth were again stored in 10% formalin at room temperature until prepped for mechanical testing.
Force to Fracture Testing
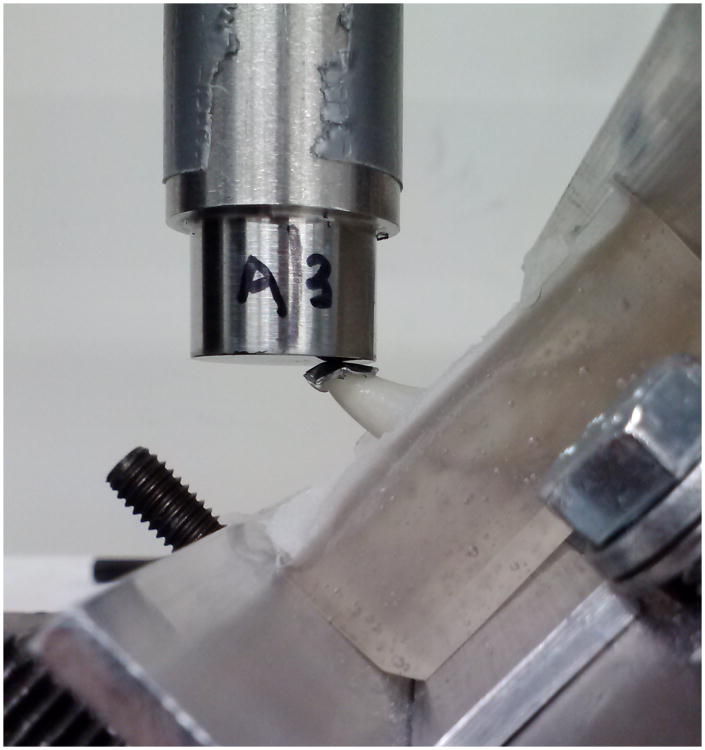
The teeth were thoroughly rinsed and dried before being potted in clear auto-polymerizing orthodontic acrylicb. The roots of the teeth were potted such that the acrylic remained 1 to 2 mm below the CEJ. The acrylic was allowed to cure for a minimum of 48 hours before testing. Each tooth was secured with a custom-made fixture within a universal materials testing machinec and a displacement with a crosshead speed of 1 mm/min was applied to the distoocclusal line angle in a distal to mesial oblique direction at an angle of 45° to the long axis of the crown (Figure 3). A 0.25 mm thick piece of aluminum foil was placed between the tooth and the load applicator in order to prevent chipping of the tooth at the point of contact9. The maximum measured force represented the force required to fracture the tooth (FF).
Figure 3.
Photograph of a tooth from group A depicting the load application set-up.
Margin of Safety Analysis
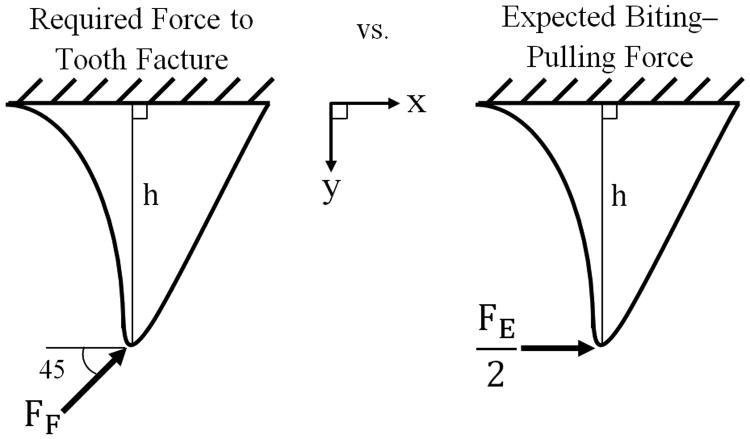
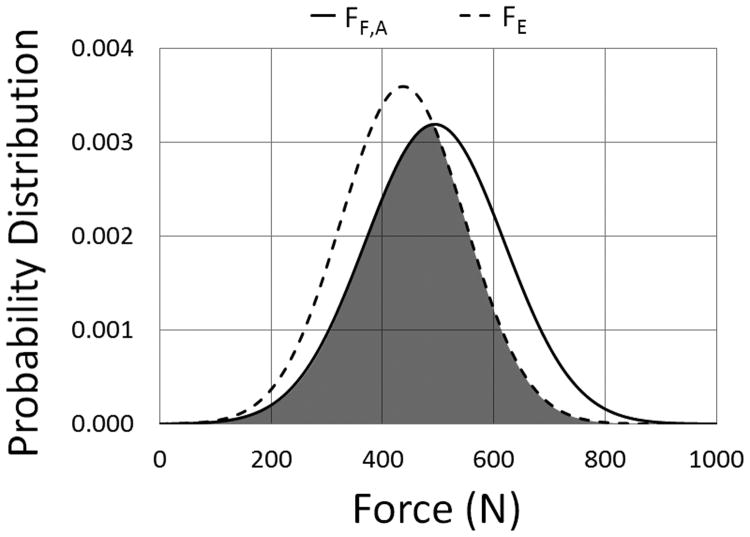
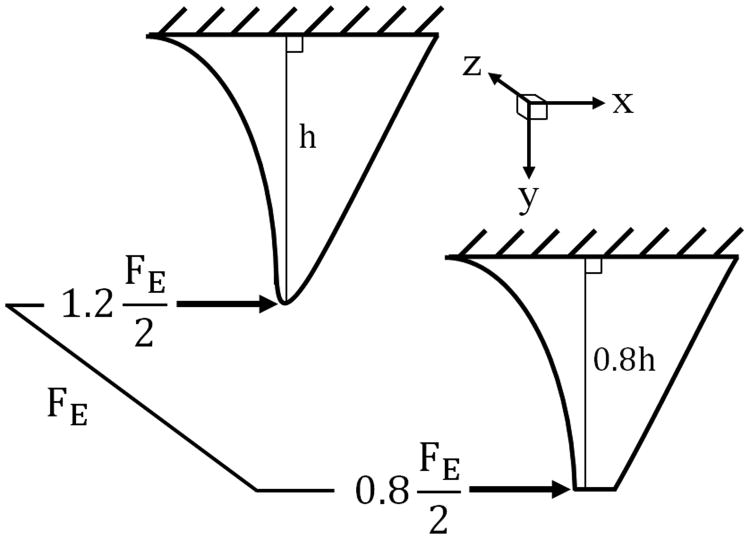
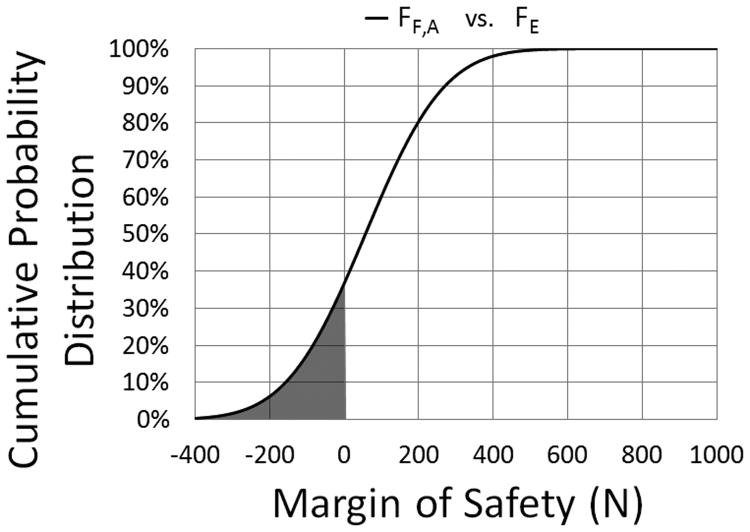
A margin of safety (MoS) analysis was performed in which the normal distributions of the required force to fracture (FF =N(μF,σF)) in the present study were compared to the expected biting-pulling force on canine teeth (FE =N(μE,σE)). The expected biting-pulling force was acquired from a previous study in which a load cell in series with a bite block, secured to a rigid structure one meter above ground (high position), was used to determine the maximum pulling force developed by six military dogs during biting exercises (FE = 480-1000 N, μE = 874, σE = 222 N).10 Assuming that the biting-pulling force measured in the referenced study was evenly distributed between the maxillary canines, half of the expected biting-pulling force was used to represent the expected loading condition for a single tooth. The model also assumed all of the load was carried by the maxillary canine teeth during biting-pulling exercises. Direct comparisons were performed between the normal distributions of the force to fracture of each H/D group of teeth and the expected loading condition for a single tooth. An illustration of the MoS analysis model can be seen in Figure 4. A plot of the normal distributions of the required force to fracture for teeth within group A (FF,A) and half of the expected biting-pulling force10 (FE) can be seen in Figure 5, where the shaded region represents probability for fracture. The normal distribution of the MoS (FMoS=N(μMoS,σMoS)) is simply the difference between FF=N(μF,σF) and FE =N(μE,σE) and was calculated using Equations 1 and 2. The probability of fracture (PFracture) is defined as the percentage of the cumulative probability distribution (P(MoS)) of the MoS = N(μMoS,σMoS) less than zero (Equation 3).
Figure 4.
Illustration of the direct comparison between the required force to fracture for teeth within group A (FF,A) and half the expected biting-pulling force10 (FE) for the Margin of Safety analysis.
Figure 5.
Probability distribution plot of the normal force distributions for the required force to fracture for teeth within group A (FF,A) versus the expected biting-pulling force 10 (FE) used for the Margin of Safety Analysis.
| (Equation 1) |
| (Equation 2) |
| (Equation 3) |
In addition to the MoS analysis, the impact of a 20% H/D reduction of a single maxillary canine on the fracture probability of the unaltered contralateral canine was determined using a paired MoS analysis wherein the expected biting-pulling force was distributed across two canine teeth according to their relative heights (Figure 6). The normal distributions of the expected shared biting-pulling forces were then compared to the normal distributions of the measured force to fracture of the matching 20% H/D reduction and unaltered group of teeth, respectively.
Figure 6.
Illustration of the height dependent force distribution of the expected biting-pulling force10 (FE) used in the paired Margin of Safety analysis.
Statistical Analysis
Means and standard deviations (μF and σF) were used to summarize the required force to fracture for teeth within each experimental group. Associations and their confidence intervals (CI) between H/D and force to fracture were assessed with three methods: linear regression; mixed effects linear regression with teeth trios as a random effect; and analysis variance (ANOVA) between experimental groups and repeated measures within teeth trios ANOVA models. The statistical assumptions of independence and normality of the errors were sufficiently met for each method. All tests were conducted at the 0.05 significance level and all analyses were done with a commercially available software programd.
Results
Fracture Resistance Analysis
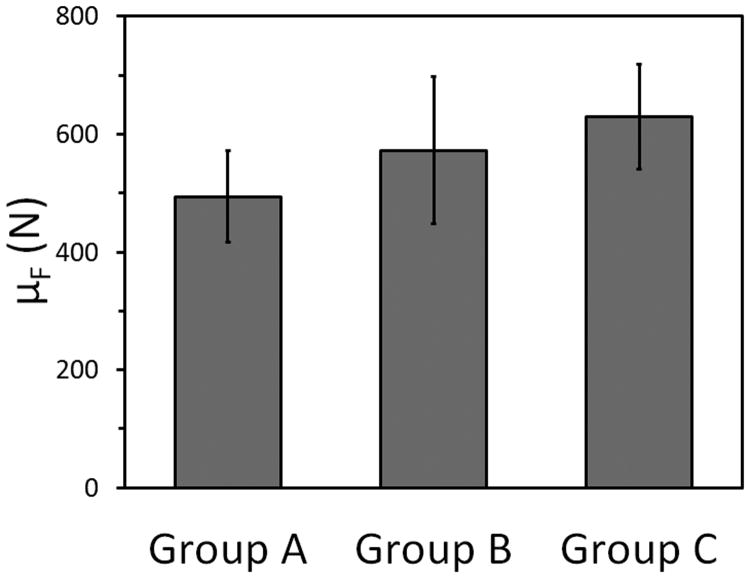
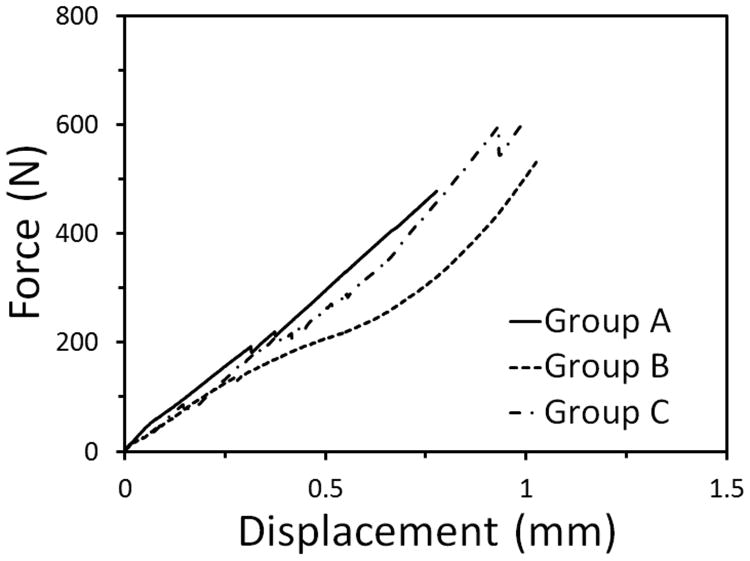
The descriptive characteristics of the teeth utilized in the study prior to and after crown reduction can be found in Tables 1 to 3. The mean forces required to fracture teeth in groups A, B and C were 494 N (range=294-687 N; median=504 N), 573 N (range=172-841 N; median=574 N) and 630 N (range=403-901 N; median=614 N), respectively. The forces required to fracture individual teeth are reported in Tables 1 to 3 and are visually represented in Figure 7. Raw force versus deflection data of select representative teeth from each group can be seen in Figure 8.
Table 1.
Physical characteristics of teeth in group A.
| Tooth | Major Axis (mm) | Minor Axis (mm) | Crown Height (H) (mm) | Total Crown Volume (mm3) | Pulp Diameter (D) (mm) | Pulp Height (mm) | Pulp Volume (mm3) | Hard Tissue Volume (mm3) | Final H/D | Force to Fracture (N) | |
|---|---|---|---|---|---|---|---|---|---|---|---|
| A-3 | 10.00 | 5.00 | 17.50 | 228.96 | 2.20 | 8.90 | 11.27 | 217.69 | 1.75 | 530.62 | |
| A-4 | 9.00 | 6.00 | 17.50 | 247.28 | 1.30 | 8.00 | 3.54 | 243.74 | 1.94 | 439.37 | |
| A-5 | 9.00 | 5.00 | 15.00 | 176.63 | 1.30 | 6.80 | 3.01 | 173.62 | 1.67 | 608.41 | |
| A-8 | 8.00 | 5.00 | 17.00 | 177.93 | 1.20 | 10.20 | 3.84 | 174.09 | 2.13 | 536.50 | |
| A-9 | 9.00 | 5.00 | 18.00 | 211.95 | 1.60 | 11.00 | 7.37 | 204.58 | 2.00 | 477.89 | |
| A-10 | 8.00 | 5.00 | 17.00 | 177.93 | 2.30 | 9.90 | 13.70 | 164.23 | 2.13 | 293.70 | |
| A-11 | 9.00 | 5.00 | 17.50 | 206.06 | 2.00 | 12.20 | 12.77 | 193.29 | 1.94 | 366.20 | |
| A-12 | 8.50 | 5.00 | 17.50 | 194.61 | 1.80 | 10.70 | 9.07 | 185.54 | 2.06 | 614.93 | |
| A-13 | 8.00 | 5.00 | 17.50 | 183.17 | 1.00 | 10.60 | 2.77 | 180.39 | 2.19 | 383.77 | |
| A-19 | 9.00 | 5.00 | 18.00 | 211.95 | 1.20 | 9.70 | 3.65 | 208.30 | 2.00 | 687.43 | |
|
| |||||||||||
| Mean | 8.75 | 5.10 | 17.25 | 201.65 | 1.59 | 9.80 | 7.10 | 194.55 | 1.98 | 493.88 | |
| Median | 9.00 | 5.00 | 17.50 | 200.34 | 1.45 | 10.05 | 5.61 | 189.42 | 2.00 | 504.25 | |
| SD | 0.63 | 0.32 | 0.86 | 24.04 | 0.46 | 1.56 | 4.32 | 24.27 | 0.17 | 124.78 | |
SD = Standard Deviation.
Table 3.
Physical characteristics of teeth in group C.
| Tooth | Major Axis (mm) | Minor Axis (mm) | Height (H) (mm) | Total Crown Volume (mm3) | Pulp Diameter (D) (mm) | Pulp Height (mm) | Pulp Volume (mm3) | Hard Tissue Volume (mm3) | Initial H/D | Final H/D (20% reduction) | Force to Fracture (N) |
|---|---|---|---|---|---|---|---|---|---|---|---|
| C-31 | 10.00 | 5.00 | 18.00 | 235.50 | 4.10 | 11.80 | 51.90 | 183.60 | 1.80 | 1.40 | 626.91 |
| C-35 | 9.00 | 6.00 | 18.00 | 254.34 | 3.40 | 11.60 | 35.09 | 219.25 | 2.00 | 1.56 | 744.63 |
| C-36 | 9.00 | 5.00 | 15.00 | 176.63 | 1.60 | 10.10 | 6.77 | 169.86 | 1.67 | 1.33 | 643.7 |
| C-37 | 8.00 | 5.00 | 17.00 | 177.93 | 1.60 | 10.50 | 7.03 | 170.90 | 2.13 | 1.70 | 457.33 |
| C-39 | 8.00 | 5.50 | 15.00 | 172.70 | 1.60 | 9.40 | 6.30 | 166.40 | 1.88 | 1.60 | 601.6 |
| C-40 | 8.50 | 6.00 | 18.00 | 240.21 | 1.50 | 10.70 | 6.30 | 233.91 | 2.12 | 1.70 | 403.3 |
| C-41 | 8.00 | 5.50 | 16.50 | 189.97 | 1.70 | 10.20 | 7.71 | 182.26 | 2.06 | 1.56 | 600.83 |
| C-43 | 9.50 | 6.00 | 18.50 | 275.93 | 3.10 | 12.10 | 30.43 | 245.50 | 1.95 | 1.65 | 900.71 |
| C-47 | 10.00 | 5.50 | 18.00 | 259.05 | 4.00 | 12.00 | 50.24 | 208.81 | 1.80 | 1.75 | 753.1 |
| C-48 | 9.00 | 5.00 | 17.50 | 206.06 | 1.00 | 11.00 | 2.88 | 203.18 | 1.94 | 1.60 | 563.78 |
|
| |||||||||||
| Mean | 8.90 | 5.45 | 17.15 | 218.83 | 2.36 | 10.94 | 20.46 | 198.37 | 1.93 | 1.58 | 629.59 |
| Median | 9.00 | 5.50 | 17.75 | 220.78 | 1.65 | 10.85 | 7.37 | 193.39 | 1.95 | 1.60 | 614.26 |
| SD | 0.77 | 0.44 | 1.27 | 38.66 | 1.16 | 0.91 | 19.52 | 28.13 | 0.15 | 0.13 | 144.92 |
SD = Standard Deviation.
Figure 7.
Mean required force to fracture (μF) for teeth within groups A, B, and C with 95% confidence intervals labeled.
Figure 8.
Force versus deflection curves of select representative teeth from groups A, B, and C. The measured maximum force represented the required force to fracture.
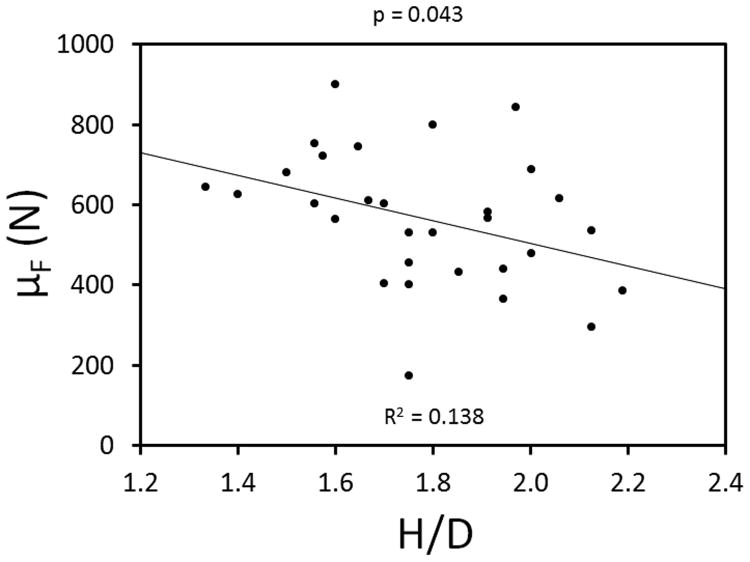
An inverse linear relationship between H/D and μF was observed (p=0.043; 95% CI -55.2 to -0.09) (Table 4 and Figure 9). No significant difference was found in the μF between groups A and B or between groups B and C. However, there was a significant difference between groups A and C. The repeated measures ANOVA within matched teeth trios revealed that a 10% reduction in H/D increased μF by 78.8 N compared to the unaltered teeth (p=0.283; 95% CI -55.9-213.6). A 20% reduction in H/D increased μF by 136 N compared to the unaltered teeth (p=0.049; 95% CI 0.9-271) (Table 5).
Table 4.
Simple linear regression and mixed effects linear regression with matched trios analyses revealing a significant inverse linear relationship between force to fracture and height to diameter ratio (H/D).
| Analysis | Estimate (95% CI) | P-value | R-squared |
|---|---|---|---|
| Simple Linear Regression (H/D by 0.1) | -28.1 (-55.2, -0.9) | 0.043 | 0.138 |
| Mixed Effects Linear Regression of Trios (H/D by 0.1) | -29.9 (-57.5, -2.3) | 0.035 | 0.155 |
Figure 9.
Linear regression model depicting the inverse linear relationship between H/D and force to fracture.
Table 5.
Repeated measures within matched teeth trios ANOVA evaluation between groups A, B, and C. A significant difference in force required to fracture teeth was noted between group A and group C.
| Group | Estimate (95% CI) | P-value | ANOVA p |
|---|---|---|---|
| A (Unaltered) | reference | reference | 0.134 |
| B (10% decrease) | 78.8 (-55.9, 213.6) | 0.235 | |
| C (20% decrease) | 135.7 (0.9, 270.5) | 0.049 |
Margin of Safety Analysis
The results of the MoS analysis are provided in Tables 6 and 7. Assuming the teeth in the present study were exposed to half the expected loads generated in the dog oral cavity10 the probabilities of fracture of the teeth in groups A, B and C were 36.7%, 27.8% and 14.5%, respectively. A plot of the cumulative probability distribution of MoS versus MoS for group A can be seen in Figure 10, where the shaded region represents fractures. Decreases in H/D of 10% and 20% resulted in a decreased probability of fracture by 24.1% and 60.4%, respectively, compared to the unaltered teeth. The paired MoS analysis found that a 20% decrease in H/D decreased the probability of fracture of that tooth by 86.5%, but increased the probability of fracture of the unaltered contralateral canine tooth by 54.4%.
Table 6. Single tooth Margin of Safety analysis.
| Group | Required Force to Fracture (FF) | Expected Biting-Pulling Force (FE) | Probability of Fracture Distribution | Probability of Fracture (%) | Change in Probability of Fracture (%) | |||
|---|---|---|---|---|---|---|---|---|
| μF (N) | σF (N) | μE (N) | σE (N) | μMoS (N) | σMoS (N) | |||
| A (Unaltered) | 494 | 125 | 437 N* | 111* | -57 | 167 | 36.7 | - |
| B (10% Decrease) | 573 | 203 | 136 | 231 | 27.8 | -24.1 | ||
| C (20% Decrease) | 630 | 145 | 193 | 183 | 14.5 | -60.4 | ||
μ = Mean; σ = Standard Deviation;
Calculated using Hamel et. al. study10 high position biting-pulling force data.
Table 7. Paired Margin of Safety analysis.
| Group | Required Force to Fracture (FF) | Expected Biting-Pulling Force (FE) | Probability of Fracture Distribution | Probability of Fracture (%) | Change in Probability of Fracture (%) | |||
|---|---|---|---|---|---|---|---|---|
| μF (N) | σF (N) | μE (N) | σE (N) | μMoS (N) | σMoS (N) | |||
| A (Unaltered) | 494 N | 125 | 524* | 133* | -30 | 183 | 56.6 | 54.4 |
| C (20% Decrease) | 630 N | 145 | 350** | 89** | 280 | 170 | 5.0 | -86.5 |
Figure 10.
Cumulative distribution plot from the Margin of Safety Analysis showing the probability of fracture for a tooth from group A.
Discussion
The present study found a significant inverse relationship between H/D and force to fracture. This inverse relationship confirms the hypothesis that reduction in H/D increases fracture resistance. There is a 95% certainty that the true increase in force required to fracture the tooth with a 20% reduction in H/D compared to the unaltered tooth is within the range of 0.9 to 271 N. This sample population estimates for every 0.1 unit increase in H/D the FF decreases on average by 29.9 N. Additionally, there is a 95% certainty that the true decrease in FF for each 0.1 increase in the H/D is in the range of 2.3 to 57.5 N. Although this inverse relationship has previously been shown with classical beam theory and finite element analyses of generic canine teeth3-5, this is the first study to show this relationship in an experiment with the natural tooth. While this concept may initially seem intuitive, obtaining the expected results substantiates the utilized methods and provides fundamental data for future research on the influence of hard tissue alteration (for example distal abrasion, crown fractures, crown preparation) on the fracture resistance of canine teeth in dogs.
The coefficient of determination (R2) estimated that only 13.8% of the variance in force to fracture found in this study could be explained by H/D alone; therefore, other factors may contribute to the fracture resistance of the tooth such as mechanical properties (e.g., modulus of elasticity, hardness, toughness), differences in hard tissue volume, and other unknown factors. One tooth in group C did not fracture at the testing system's upper limit of approximately 900 N. The H/D of this particular tooth was 1.65, which was higher than other teeth that did fracture. Thus, this single tooth could be considered further evidence that factors other than H/D have an influence on the fracture resistance of teeth. One study suggested that the fracture resistance of bovine enamel and dentin varies depending on the direction of the dentinal tubules relative to the direction of incremental lines representing daily dentinogenesis, which can vary based on the location on the tooth.11 However, systematic studies on the mechanical properties of canine teeth in carnivores have not been reported.
Due to methodological challenges, few studies reporting the measured bite force in dogs exist. In a study of bite forces in live dogs of varying size and bite enthusiasm, bite force measurements ranged between 13 and 1394 N (mean 256 N).12 However, that study did not measure forces isolated to the canine tooth as was applied in the present study. Forces generated near the canine tooth by electrical stimulation in anesthetized dogs have also been reported.13 The forces were measured just distal to the canine teeth and were found to be between 147 and 926 N. The range of forces required to fracture teeth in the present study fell just within the low and high end of this range. Further, most canine teeth do not fracture under occlusally directed masticatory loads. Canine teeth more often fracture due to a frontally-mediated traumatic force or biting-pulling forces, supporting the use of the biting-pulling forces reported by Hamel and co-workers10 in the MoS analysis of the present study. In 90%, 60%, and 70% of the teeth from groups A, B, and C, respectively, the teeth fractured within the range of 300 to 700 N. Therefore, it is plausible that canine teeth of any height may fracture under the forces that dogs can generate during biting-pulling exercises. Despite the relatively high prevalence of canine tooth fractures reported in previous studies1,2 and the comparable 36.7% probability of fracture found in the present study, the typical force applied to the canine teeth during routine activity likely falls short of what is required to fracture the tooth in most dogs.
The ratio between the force required to cause a structure to fail and the force that the structure is expected to withstand in routine use is commonly referred to as the factor of safety.7 Zoological studies of wild canid and felid dentition present the hypothesis that the factor of safety is larger in biological structures when their failure is associated with greater consequences.7 Given that fractured teeth do not have the ability to repair themselves after fracture (a significant consequence), an argument could be made that teeth should possess a high factor of safety that would allow teeth to withstand high forces.7 However, previous studies in wild canids have shown otherwise.7 Similar to a factor of safety calculation, the present study utilized a MoS analysis to compare the normal distributions of a structure's strength to the expected loads; and, therefore to determine the probability of failure of the structure. In the present study, the MoS analysis was performed to determine the probability of fracture of a canine tooth when subjected to typical biting-pulling forces. As such, the MoS analysis utilized the normal distributions of FF and FE10 to determine the probability of fracture of each tooth. All canine teeth in the present study fractured within the reported range of forces generated near the canine tooth in domestic dogs. The MoS analysis predicted that if FE10 was applied to the unaltered group, 36.7% of the teeth would fracture. Therefore, the MoS of the canine tooth in domestic dogs may be considered low. The MoS of the tested teeth increased as the H/D decreased. At a 10% and 20% H/D reduction, the probability of the tooth fracturing was reduced by 24.1% and 60.4%, respectively.
This study has shown that a reduction in H/D would improve the fracture resistance of a canine tooth. However, during normal oral activity, forces are not isolated to a single tooth and are distributed to other canine teeth. Therefore, the impact of a height reduction of one tooth on the remaining unaltered canine teeth must be considered. To assess this effect, a paired MoS analysis was utilized. The paired MoS analysis found that a 20% H/D reduction of one canine tooth reduced its probability of fracture by 86.5%. However, reduction of the H/D of one canine tooth is potentially detrimental to the fracture resistance of the remaining unaltered teeth as evidenced by a 54.4% increase in probability of fracture of the unaltered contralateral canine tooth. Veterinarians must be cognizant that efforts to improve the biomechanics of a single tooth by altering H/D may have a negative influence on the biomechanics on the entire oral cavity. An ideal H/D may exist that maintains proper function of the oral cavity and maximizes fracture resistance of the tooth in question. However, that information cannot be determined from this study alone and further investigation into this possibility should be pursued. Additionally, studies evaluating the impact of H/D reduction on previously traumatized teeth would be beneficial.
Several limitations are acknowledged in the present study's methods. On the subject of sample population, the present study was limited to a single breed of dog for the source of canine teeth. Further, the MoS analysis of the present study only utilized the high position mean biting pulling force (μE) and standard deviation (σE) of five military dogs. The high position data were used as they were higher than that of the low position, therefore representing the worst case scenario. Despite the small and relatively uniform sample population, the results of the present study concur with several epidemiologic studies showing a relatively high rate of canine tooth fractures in dogs and other carnivores.1,2,7,14 However, the prevalence of clinical tooth fractures is highly dependent on factors for which the present study did not account. Such factors may include dog breed and size, presence of pre-existing dental wear or other iatrogenic alteration, parafunctional habits of the dog, work demand of the dog, and chewing/bite enthusiasm.12,13 As such, the results of this study may not apply to all dogs. Though efforts were made to limit the variability between samples using the H/D and grouping based on mean hard tissue volume, variability in material and mechanical properties between samples likely still exist. Further, the hard tissue volume calculations of the present study can only be considered as estimates since the canine tooth does not have a uniform shape.
In terms of the mechanical testing, the present study was limited in its ability to replicate the natural oral cavity environment. The teeth used in this study were stored in 10% formalin until mechanically tested. This practice followed the recommended infection control guidelines for use of extracted teeth by the Center for Disease Control.15 The influence of 10% formalin on the mechanical properties of teeth has not been studied extensively but is of some concern. One study performed tensile and three-point bending mechanical tests to determine the strength of human dentin stored in either formalin, deionized water, or saline and found that the storage medium had no significant influence on the fracture strength or fracture toughness8. The authors concluded that extracted teeth should be stored in formalin prior to mechanical testing. The teeth were tested dry, at room temperature, and at a rate of 1 mm/s. Testing the teeth outside of a warm saline environment may have influenced the results of the present study. Displacement rates for acute trauma may be much higher than applied in the present study and may reduce the FF in the field compared to in the lab. Therefore, the results of the present study may have overestimated the true MoS of canine teeth. Concerning the MoS, the probability of fracture calculations assumed that both the FF and FE were normally distributed. Any skewedness in either data set could cause over- or under-estimation of the true probability of canine tooth fracture in the present study.
The experimental setup of the present study placed the load on the tip of the canine tooth at a 45° angle to the long axis of the tooth. This load vector generated combined compressive axial and bending stresses within the tooth. A literature review on the subject of load placement on the canine tooth failed to reveal any documentation of the exact location and direction of load that is typically carried by the canine tooth. Other biomechanical studies of canine teeth have, often out of necessity, evaluated forces that are either perpendicular to (transverse) or parallel to (axial) the long axis of the tooth.3 These forces certainly occur in dogs but fail to account for the combined effect of axial and transverse loads that typically arise when a dog bites into and pulls on an object. The methods used in this study to model the natural fixation of a canine tooth failed to account for the compliance of a periodontal ligament. The relatively stiff potting medium introduced an artificial stress concentration at the base of the tooth and reduced the deflection of the tooth prior to fracture. Despite the stress concentration at the base of the tooth, the fracture patterns of the teeth reflected those seen clinically. Therefore, it can be concluded that the load application and potting medium did not compromise the results of the present study. To account for the complex loading, geometry and mechanical properties of the tooth, periodontal ligament, and alveolar bone interface, a finite element analysis, like that of Freemen and Lemen4, would need to be conducted.
Lastly, the scope of the present study was limited to investigating the effect of H/D on fracture resistance. Although the influence of crown preparation design on the fracture resistance of canine teeth was not evaluated in the present study, given the hypothesis that crown height reduction prior to full coverage crown therapy may improve the fracture resistance of the tooth, the various other factors manipulated during crown preparation design are important considerations. As such, care should be taken when comparing the results of the present study to the results of others.
In conclusion, the results of the present study support the hypothesis that reduction in the H/D of the canine tooth in dogs increases fracture resistance of a single tooth and may suggest future clinical implications. In addition, the results of the present study serve as a foundation of data for future research on the clinical management of traumatized teeth. However, studies evaluating the potential advantages and disadvantages of crown height reduction as opposed to other crown strengthening methods (e.g. full coverage crown) would be warranted. Therefore, the clinical questions of the existence of an ideal H/D which balances proper function of the oral cavity with maximized fracture resistance and the applicability of routine crown height reduction to reduce fracture susceptibility require further investigation. Future biomechanical and clinical investigations of the short- and long-term consequences of crown height reduction should be conducted prior to routine institution.
Table 2.
Physical characteristics of teeth in group B.
| Tooth | Major Axis (mm) | Minor Axis (mm) | Height (H) (mm) | Total Crown Volume (mm3) | Pulp Diameter (D) (mm) | Pulp Height (mm) | Pulp Volume (mm3) | Hard Tissue Volume (mm3) | Initial H/D | Final H/D (10% reduction) | Force to Fracture (N) |
|---|---|---|---|---|---|---|---|---|---|---|---|
| B-14 | 8.00 | 5.00 | 18.00 | 188.40 | 2.80 | 11.80 | 24.21 | 164.19 | 2.25 | 1.58 | 841.47 |
| B-15 | 9.00 | 5.00 | 18.00 | 211.95 | 3.20 | 11.30 | 30.28 | 181.67 | 2.00 | 1.75 | 531.17 |
| B-17 | 8.00 | 5.00 | 16.00 | 167.47 | 0.80 | 8.30 | 1.39 | 166.08 | 2.00 | 1.50 | 799.9 |
| B-18 | 8.00 | 5.00 | 17.00 | 177.93 | 0.60 | 10.40 | 0.98 | 176.95 | 2.13 | 1.91 | 566.41 |
| B-21 | 10.00 | 5.50 | 18.50 | 266.25 | 3.60 | 13.20 | 44.76 | 221.48 | 1.85 | 1.80 | 680.05 |
| B-25 | 8.00 | 5.00 | 17.00 | 177.93 | 1.20 | 10.90 | 4.11 | 173.83 | 2.13 | 1.91 | 581.76 |
| B-27 | 9.50 | 5.50 | 18.00 | 246.10 | 2.70 | 10.80 | 20.60 | 225.50 | 1.89 | 1.75 | 721.66 |
| B-28 | 9.00 | 5.50 | 17.00 | 220.19 | 1.80 | 11.00 | 9.33 | 210.87 | 1.89 | 1.85 | 172.21 |
| B-29 | 9.00 | 6.00 | 18.50 | 261.41 | 3.50 | 13.20 | 42.31 | 219.09 | 2.06 | 1.97 | 431.49 |
| B-34 | 9.50 | 6.00 | 18.00 | 268.47 | 3.50 | 12.00 | 38.47 | 230.01 | 1.89 | 1.80 | 401.19 |
|
| |||||||||||
| Mean | 8.80 | 5.35 | 17.60 | 218.61 | 2.37 | 11.29 | 21.64 | 196.97 | 2.01 | 1.78 | 572.73 |
| Median | 9.00 | 5.25 | 18.00 | 216.07 | 2.75 | 11.15 | 22.40 | 196.27 | 2.00 | 1.80 | 574.09 |
| SD | 0.75 | 0.41 | 0.81 | 39.76 | 1.17 | 1.42 | 17.07 | 26.64 | 0.13 | 0.15 | 202.53 |
SD = Standard Deviation.
Footnotes
Scan × Scout, Air Techniques, Melville, NY
Hygenic orthodontic resin, Coltene/Whaledent, Inc., Cuyahoga Falls, OH
MTS Criterion – Model C43, Eden Prairie, MN
R open access statistical software, version 2.15, The R Project for Statistical Computing, www.r-project.org
Contributor Information
Jason W. Soukup, Email: soukupj@svm.vetmed.wisc.edu, Dentistry and Oral Surgery, School of Veterinary Medicine, University of Wisconsin-Madison, Madison, WI.
Caitlyn Collins, Bone and Joint Biomechanics Lab, University of Wisconsin-Madison, Madison, WI.
Heidi-Lynn Ploeg, Bone and Joint Biomechanics Lab, University of Wisconsin-Madison, Madison, WI.
References
- 1.Golden AL, Stoller M, Harvey CE. A survey of oral and dental diseases in dogs anesthetized at a veterinary hospital. J Am Anim Hosp Assoc. 1982;18:891–899. [Google Scholar]
- 2.Soukup JW, Hetzel S, Paul A. Classification and epidemiology of traumatic dentoalveolar injuries in dogs and cats: 959 injuries in 660 patient visits (2004-2012) J Vet Dent. doi: 10.1177/089875641503200101. In press. [DOI] [PubMed] [Google Scholar]
- 3.Lawn BR, Chai H, Barani A, et al. Transverse fracture of canine teeth. J Biomech. 2013;46:1561–1567. doi: 10.1016/j.jbiomech.2013.03.018. [DOI] [PubMed] [Google Scholar]
- 4.Freemen PW, Lemen CA. An experimental approach to modeling the strength of canine teeth. J Zool. 2007;271:162–169. [Google Scholar]
- 5.Freemen PW, Lemen CA. The trade off between tooth strength and tooth penetration: predicting optimal shape of canine teeth. J Zool. 2007;273:273–280. [Google Scholar]
- 6.Soukup JW, Snyder CJ, Karls TL, et al. Achievable convergence angle and the effect of preparation design on the clinical outcome of full veneer crowns in dogs. J Vet Dent. 2011;28(2):72–82. doi: 10.1177/089875641102800203. [DOI] [PMC free article] [PubMed] [Google Scholar]
- 7.van Valkenburgh B. Incidence of tooth breakage among large, predatory mammals. Am Nat. 1988;131:291–302. [Google Scholar]
- 8.Jameson MW, Tidmarsh BG, Hood JA. Effect of storage media of subsequent water loss and regain by human and bovine dentin and on mechanical properties of human dentine in vitro. Arch Oral Biol. 1994;39:759–767. doi: 10.1016/0003-9969(94)90005-1. [DOI] [PubMed] [Google Scholar]
- 9.Potiket N, Chichi G, Finger IM. In vitro fracture strength of teeth restored with different all-ceramic crown systems. J Prosthet Dent. 2004;92:491–495. doi: 10.1016/j.prosdent.2004.09.001. [DOI] [PubMed] [Google Scholar]
- 10.Hamel L, Le Brech C, Besnier NJ, et al. Measurement of biting-pulling strength developed on canine teeth in military dogs. J Vet Dent. 1997;14:57–60. [Google Scholar]
- 11.Wang R. Anisotropic fracture in bovine root and coronal dentin. Dent Mat. 2005;21:429–436. doi: 10.1016/j.dental.2004.07.008. [DOI] [PubMed] [Google Scholar]
- 12.Linder DL, Marreta SM, Pijanowski GJ et al. Measurement of bite force in dogs: A pilot study. J Vet Dent. 1995;12:49–52. [PubMed] [Google Scholar]
- 13.Ellis JL, Thomason JJ, Kebreab E, et al. Calibration of estimated biting forces in domestic canids: comparison of post-mortem and in vivo measurements. J Anat. 2008;212:769–780. doi: 10.1111/j.1469-7580.2008.00911.x. [DOI] [PMC free article] [PubMed] [Google Scholar]
- 14.Furtado MM, Kashivakura CK, Ferro C et al. Prevalence of crown trauma in free-ranging maned wolves (Chrysocyon brachyurus) in central Brazil. J Vet Dent. 2007;24:231–234. doi: 10.1177/089875640702400404. [DOI] [PubMed] [Google Scholar]
- 15.Kohn W, Collins A, Cleveland H et al. Centers for disease control and prevention. Guidelines for infection control in dental health-care settings: 2003. MMWR Recomm Rep. 2003;52:1–61. [PubMed] [Google Scholar]


