Fig. 3.
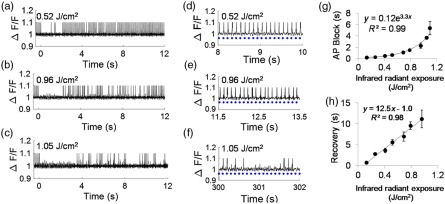
Representative QuasAr2 fluorescence spike plots (from a single neuron per exposure) show block and recovery following a (a) 0.52, (b) 0.96, and (c) SILP. Blue light was pulsed at 10 Hz. SILP exposure at . Recovery of blue light stimulated AP is demonstrated at (d) 8 to 10 s for the SILP [same cell as (a)], (e) 11.5 to 13.5 s for the SILP [same cell as (b)], and (f) 300 (5 min) to 302 s for the SILP [same cell as (c)]. Blue dots represent blue light exposure. (g) The average length of SILP-induced AP block increased with increased exposure ( to 33 cells/data point; ). (h) The average time of recovery to 100% firing efficiency increased with SILP exposure ( to 22 cells, ).

