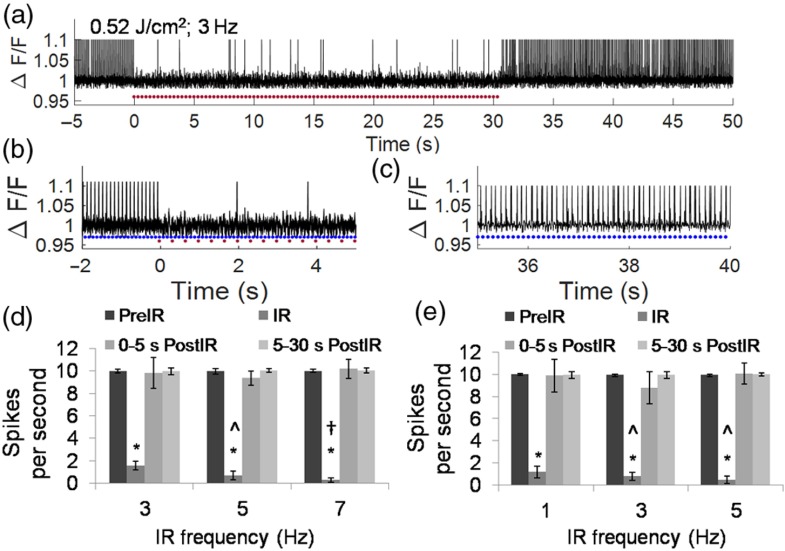
Fig. 4.
(a) Representative QuasAr2 fluorescence spike plot demonstrating consistent AP generation prior to SILPs, reduced AP activity during the repeated SILPs (; 3 Hz), and following the SILP exposure. Blue light (5-ms exposure) was pulsed at 10 Hz. Red dots represent SILPs. (b) Enlarged display of to 5 s data in (a), showing the consistent APs prior to the SILP exposure (); and the block during exposure (). Blue dots represent blue light exposure. (c) Enlarged display of the 35 to 40 s data in (a) showing recovery of consistent AP. (d) Average SPS for neurons prior to SILP (blue led pulsed at 10 Hz), during 30 s of SILP pulsed at 3 ( cells), 5 ( cells), or 7 ( cells) Hz, and following SILP. , to 9 cells. * versus pre-SILP. ^ versus 3 Hz SILP. † versus 5 Hz SILP. (e) Average SPS for neurons prior to SILP (blue light pulsed at 10 Hz), during 30 s of SILP pulsed at 1 ( cells), 3 ( cells), or 5 ( cells) Hz, and following SILP. , * versus pre-SILP. ^ versus infrared 1 Hz.

