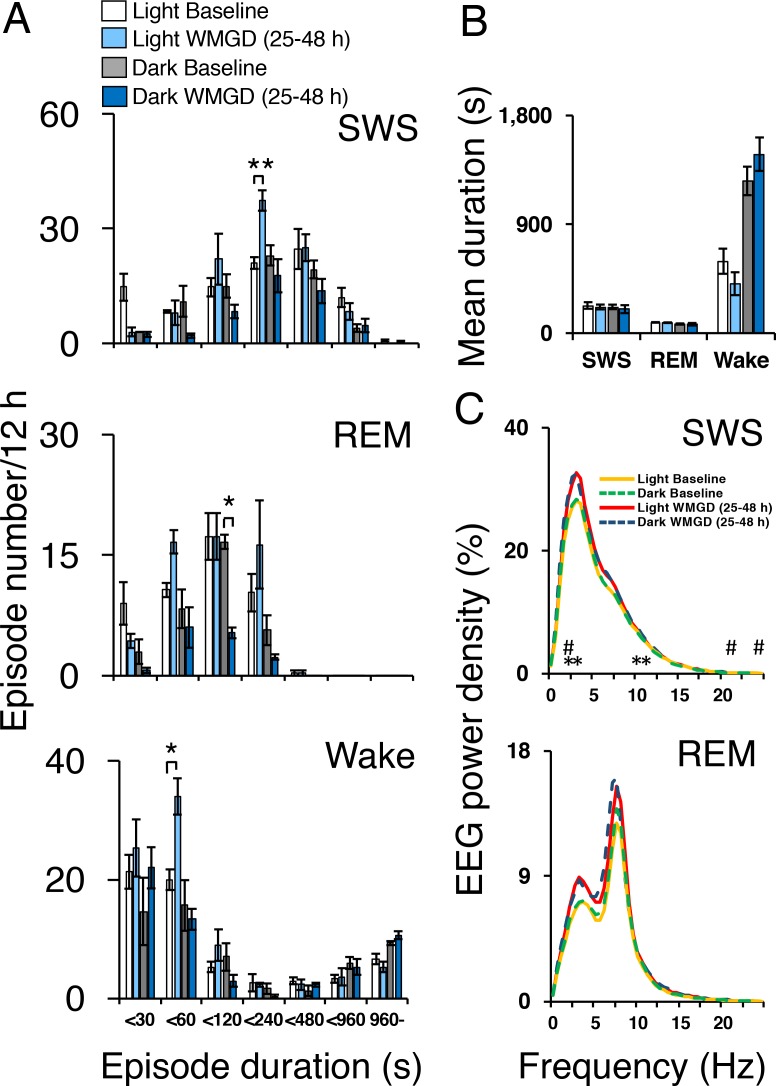
Figure 2. Sleep-wake profiles under baseline and wire-mesh-grid device (WMGD) conditions in mice for a 25–48 hr period, assessed by EEG/EMG recordings.
(A and B) Effect of the WMGD on episode number (A) and duration (B) of slow wave sleep (SWS), REM sleep and wake during the light and dark phases. *p < 0.05 and **p < 0.01, indicates significant differences between baseline and WMGD exposure (n = 3). (C) EEG power density of SWS and REM sleep episodes in the light and dark phases. # and * symbols indicate significant differences (p < 0.01) between baseline and WMGD exposure during light (#) and dark phases (*).

