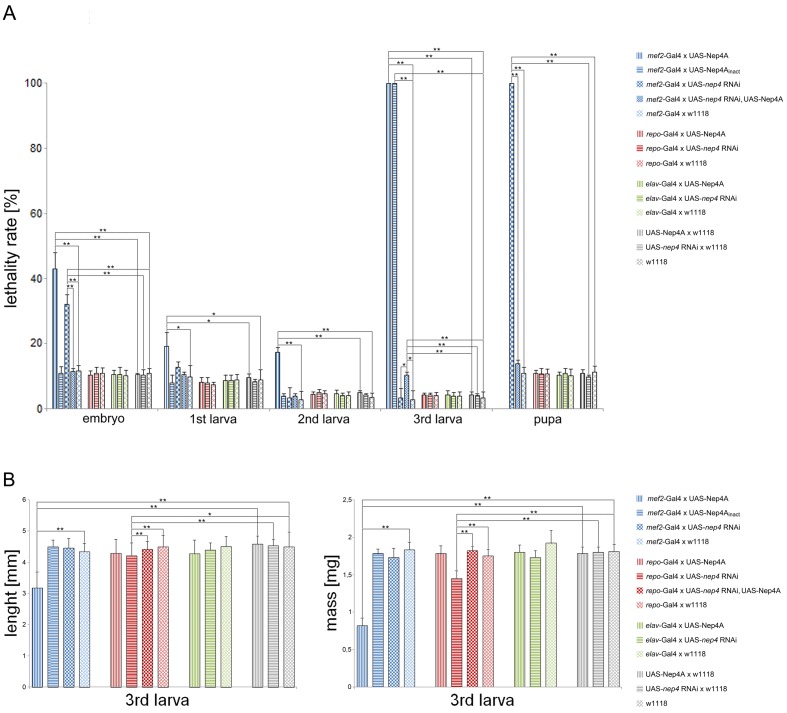
Figure 1. Modulating nep4 expression affects life span and body size.
(A) Lethality assay. The percentages (%) of animals of a specific stage that did not develop into the next stage are shown. While muscle-specific overexpression of Nep4A (mef2-Gal4 x UAS-Nep4A) led to biphasic lethality with critical phases during embryonic and late larval development, overexpression of catalytically inactive Nep4A in the same tissue (mef2-Gal4 x UAS-Nep4Ainact) led to lethality only in the third instar larval stage. Muscle-specific nep4 knockdown (mef2-Gal4 x UAS-nep4 RNAi) slightly increased embryonic lethality, but the majority of the animals died as pupae. Glial cell-specific overexpression (repo-Gal4 x UAS-Nep4A) or knockdown of the peptidase (repo-Gal4 x UAS-nep4 RNAi) did not affect life span, which was also observed for neuronal overexpression or knockdown (elav-Gal4 x UAS-Nep4A; elav-Gal4 x UAS-nep4 RNAi). mef2-Gal4 x w1118, repo-Gal4 x w1118, elav-Gal4 x w1118, UAS-Nep4A x w1118, UAS-nep4 RNAi x w1118, and w1118 were used as controls. Asterisks indicate statistically significant deviations from the respective controls (*p<0.05, **p<0.01, one-way ANOVA with pairwise comparisons). (B) Size and weight measurements. While muscle-specific overexpression of Nep4A (mef2-Gal4 x UAS-Nep4A) reduced the size and wet mass of third instar larvae, neither overexpression of catalytically inactive Nep4A in the same tissue (mef2-Gal4 x UAS-Nep4Ainact) nor muscle-specific nep4 knockdown (mef2-Gal4 x UAS-nep4 RNAi) significantly affected these parameters. Glial cell-specific overexpression of the peptidase (repo-Gal4 x UAS-Nep4A) did not alter size or weight, while downregulation of the peptidase in the same tissue (repo-Gal4 x UAS-nep4 RNAi) slightly, but significantly, reduced both parameters. Neuronal overexpression or knockdown of nep4 (elav-Gal4 x UAS-Nep4A; elav-Gal4 x UAS-nep4 RNAi) had no effect on size or weight. Control lines were the same as in A. Asterisks indicate statistically significant deviations from respective controls (*p<0.05, **p<0.01, one-way ANOVA with pairwise comparisons).
DOI: http://dx.doi.org/10.7554/eLife.19430.003

