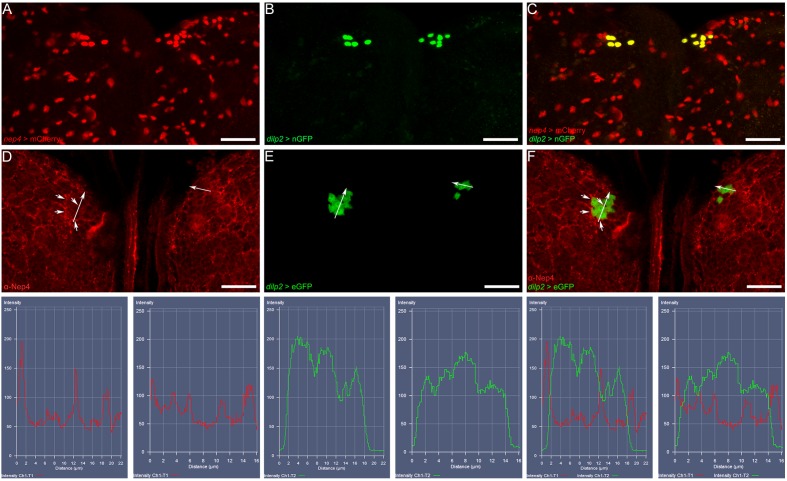
Figure 6. Nep4 localizes to the surface of insulin-producing cells.
(A–C) nep4 expression was assessed using a reporter line that drives nuclear mCherry expression in a nep4-specific manner (nep4 > mCherry, red). dilp2 expression was visualized using a reporter construct that drives nuclear GFP expression in a dilp2-specific manner (dilp2 > nGFP, green). Depicted are optical sections (10 µm) of a third instar larval central brain. Scale bars: 20 µm; dorsal view, anterior up. nep4 and dilp2 expression colocalized in IPCs. (D–F) Nep4 protein was labeled with a monospecific antibody (red), and dilp2 expression was visualized using an eGFP reporter line (dilp2 > eGFP, green). Depicted are optical sections (10 µm) of a third instar larval central brain. Scale bars: 20 µm; dorsal view, anterior up. Nep4 accumulated at the surface of numerous cells, including IPCs (D, F, arrowheads). The subcellular localization was assessed with fluorescence intensity measurements (lower panel). The respective regions of evaluation are marked (arrows in D–F).

