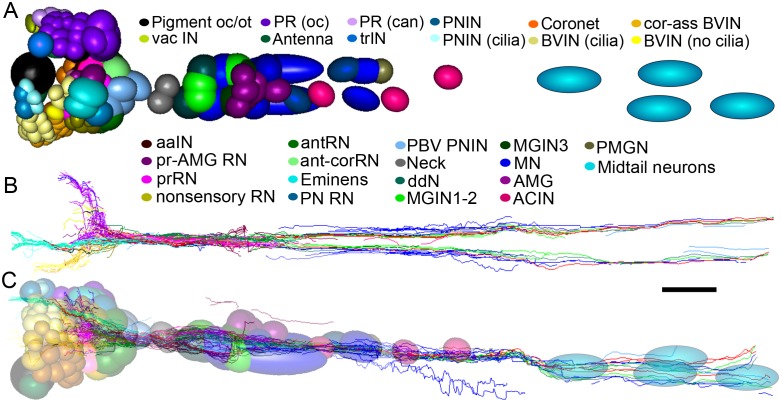
Figure 7. Representation and relative sizes of cell bodies and their positions along the neuraxis, with corresponding axon tracts.
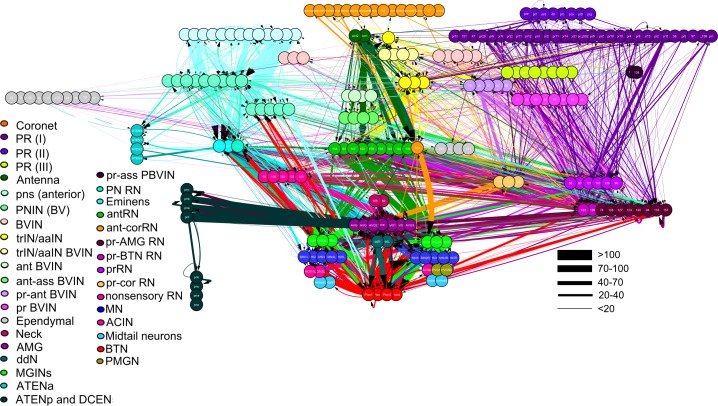
(A) Cell bodies of CNS neurons, dorsal view. Colours denote cell types (key). (B) Corresponding axon tracts, shown as skeleton reconstruction, dorsal view, colours as in (A) (for a network graph of synaptic connectome formed by corresponding neurons sorted by connectivity see Figure 7—figure supplement 1). (C) Cell bodies of CNS neurons and axon tracts, corresponding to (A) and (B), left lateral view. Pigment oc/ot: ocellus and otolith pigment cells; PR (oc): type I photoreceptor; PR (can): type II photoreceptor; PNIN: peripheral interneuron; PNIN (cilia) peripheral interneuron with cilium; vac IN: vacuolated photoreceptor-associated interneuron; Antenna: antenna cell; Coronet: coronet cell; aaIN: anaxonal arborizing interneuron; BVlN (cilia): ciliated brain vesicle interneuron: pr-AMG RN: photoreceptor-AMG relay neuron; trIN: photoreceptor tract interneuron; cor-ass BVIN: ciliated coronet associated brain vesicle interneuron; prRN: photoreceptor relay neuron; BVIN (no cilia): brain vesicle interneuron lacking cilium; non-sensory relay neuron (RN); antRN: antenna relay neuron; ant-corRN: antenna-coronet relay neuron: Eminens: eminens neuron: PNRN: peripheral relay neuron: PBV PNIN: posterior brain vesicle peripheral interneuron; MGINs 1–2: motor ganglion paired interneurons 1 and 2; MGINs 3: motor ganglion paired interneurons 3; ddN: descending decussating neuron pair: AMG: ascending motor ganglion neuron; MN: motor neuron: ACIN: ascending contralateral inhibitory neuron; PMGN: posterior motor ganglion neuron; Midtail neurons: short descending neurons of the caudal nerve cord. Scale bar 10 µm.


