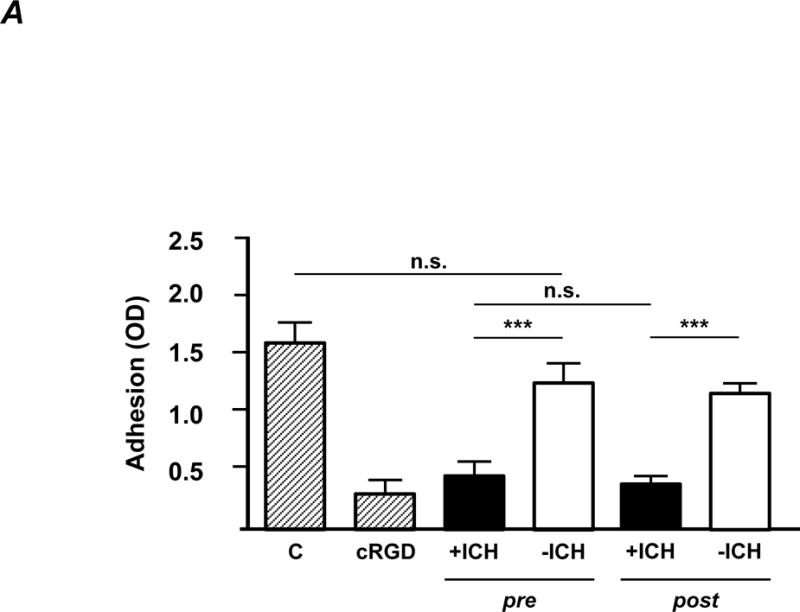
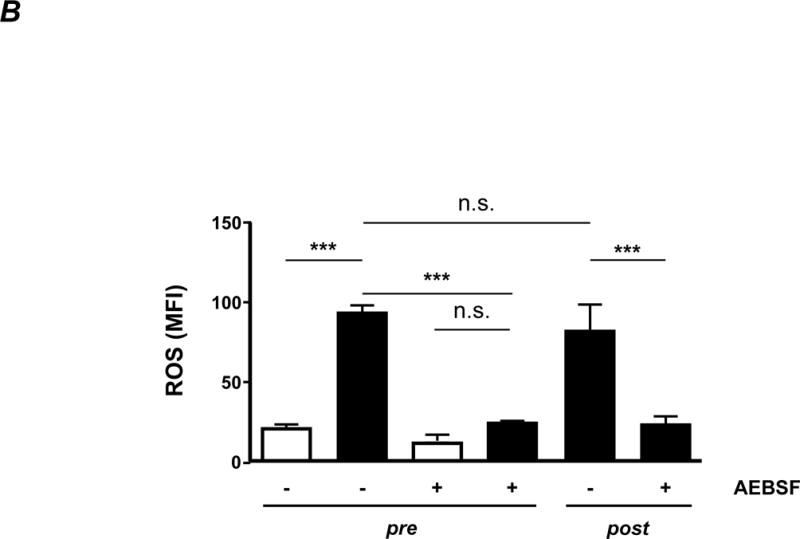
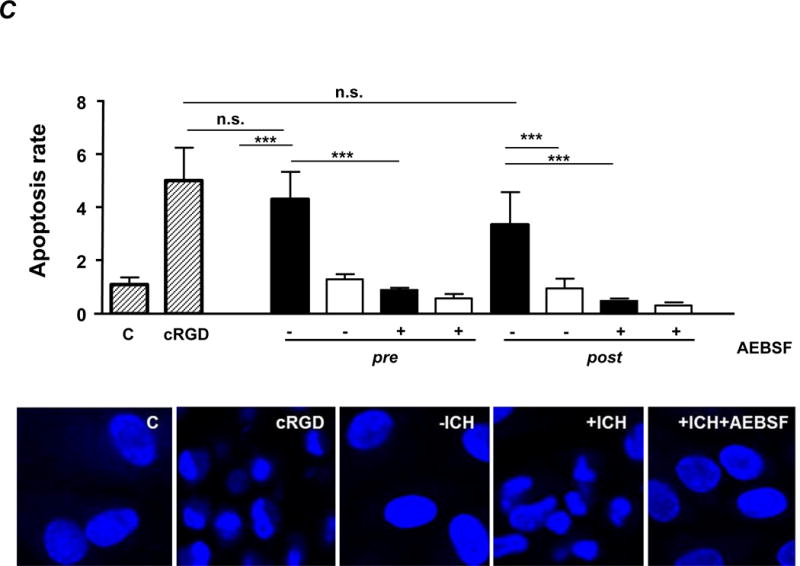
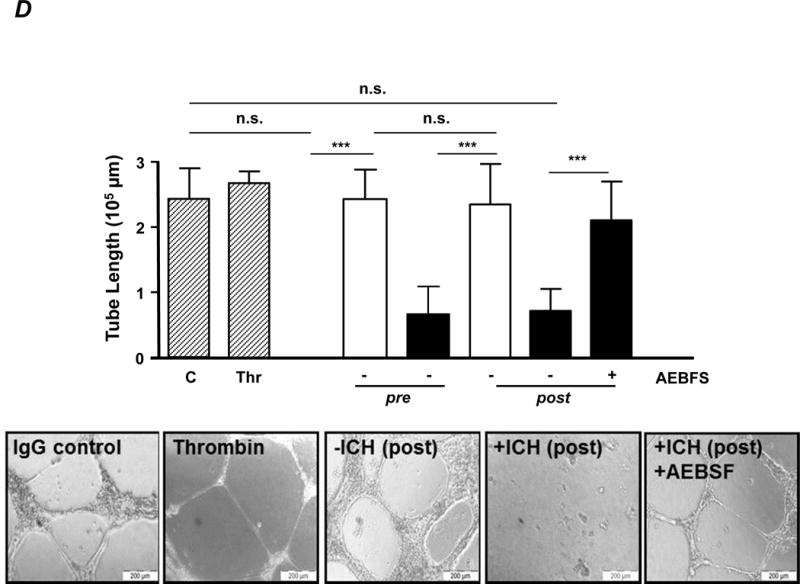
Figure 3. The avb3-specific subtype of anti-HPA-1a interferes with endothelial function.


IgG was purified from maternal sera from +ICH cases (n=9; black columns) and from −ICH cases (n=9; white columns) either before (pre) or after (post) absorption with aIIbb3 beads and then further studied.
A. Cell adhesion. Endothelial cells were incubated with purified IgG (20 μg/ml) and added onto microtiter wells pre-coated with vitronectin. After washings, adherent cells were stained with crystal violet and measured in an ELISA reader. Statistical analysis was performed by 1-way ANOVA followed by Bonferroni’s post-hoc test; n.s. = not significant. C = control IgG from healthy donors; cRGD was used as a positive control. Note that only antibodies from +ICH cases hinder endothelial cell adhesion, with no difference between pre- and post-absorption experiments.
B. ROS production. Endothelial cells were incubated with purified IgG (20 μg/ml) in the presence of DCFDA. The production of fluorescent DCF correlates with cellular ROS production and was measured by flow cytometry. AEBSF was used as an antioxidant in some experiments, as indicated. Statistical analysis was performed by 1-way ANOVA followed by Bonferroni’s post-hoc test. n.s. = not significant. Note that only antibodies from +ICH cases induce endothelial ROS, with no difference between pre- and post-absorption experiments.
C. Cell apoptosis. Purified IgG (20 μg/ml) was added to endothelial monolayers and caspase 3/7 activity was measured by luminometry (upper panel). Some experiments were performed in the presence of a ROS inhibitor (AEBSF). Statistical analysis was performed by 1-way ANOVA followed by Bonferroni’s post-hoc test; n.s. = not significant; C = control IgG from healthy donors. cRGD was used as positive control. Note that only antibodies from +ICH cases induce apoptosis, with no difference between pre- and post-absorption experiments. Nucleus staining of endothelial cells with DAPI after incubation with anti-HPA-1a IgG post-absorption and controls was performed (lower panel). Representative pictures (60fold magnification) from n=9 independent experiments per cohort are shown.
D. Tube formation. Purified IgG (40 μg/ml) was added to endothelial cells, and tube formation was investigated by microscopy. Data are given as mean of tube length in μm +SD (upper panel). Some experiments were performed in the presence of a ROS inhibitor (AEBSF) as indicated. Statistical analysis was performed by 1-way ANOVA followed by Bonferroni’s post-hoc test; n.s. = not significant. C = control IgG; Thr = thrombin. Note that only antibodies from +ICH cases reduce tube length, with no difference between pre- and post-absorption experiments. Representative microphotographs of endothelial tube formation assays as outlined are given in the lower panel.
