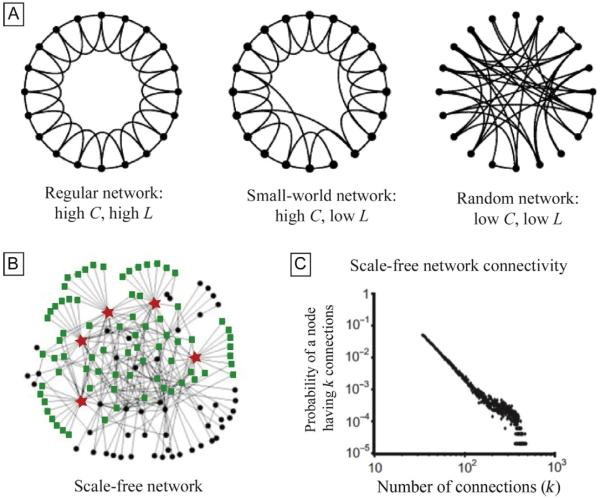
FIG. 2.
Introduction to graph theory. (A) Illustration of the progression from a regular network to a small-world network to a random network. A regular network has a high number of local connections and no long-distance connections, resulting in a high clustering coefficient (C) and a high path length (L). By replacing a few local connections with long-distance connections, the overall shortest path length (L) is dropped significantly, and yet a high C remains, creating a small-world network. In a random network, the small probability of local connections and the low number of randomly created long distance connections result in low C and low D. (B) A graphical representation of a scale-free network demonstrates a small number of highly connected nodes or hubs, represented by stars. These five hubs make primary connections with 60% of the rest of the nodes in the graph (rectangles). This is in contrast to an exponential network (not shown), in which the five most highly connected nodes only primarily contact 27% of all nodes in the graph. (C) A log–log graph demonstrates the power law relationship between the probability of a node having k connections (y-axis) and the number of connections in the graph (x-axis).
Panel (A): adapted from Watts, D.J., Strogatz, S.H., 1998. Collective dynamics of “small-world” networks. Nature 393 (6684), 440–442; panel (B): adapted from Albert, R., Jeong, H., Barabasi, A.L., 2000. Error and attack tolerance of complex networks. Nature 406, 378–382; and panel (C): adapted from Morgan, R.J., Soltesz, I., 2008. Nonrandom connectivity of the epileptic dentate gyrus predicts a major role for neuronal hubs in seizures. Proc. Natl. Acad. Sci. U.S.A. 105 (16), 6179–6184.

