
Figure 2.
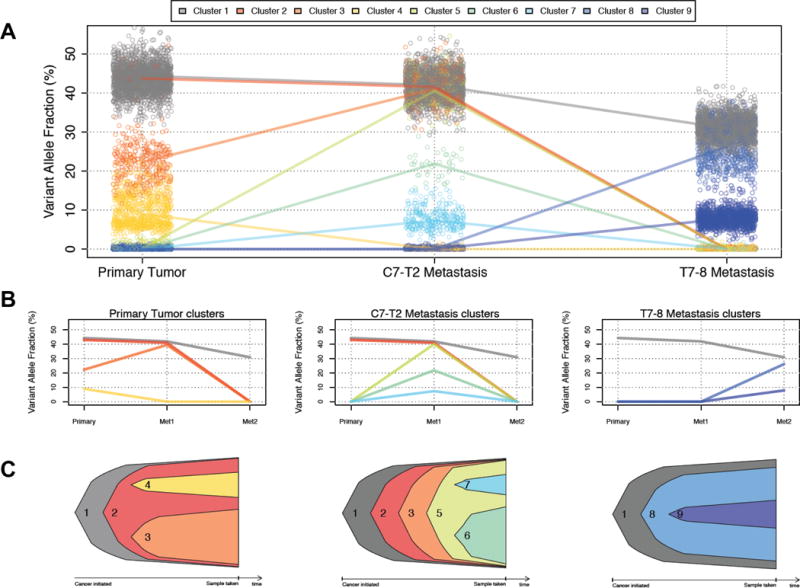
Clonal evolution of a glioblastoma and two metastases. (A) Three-dimensional clustering of variant allele frequencies infers nine distinct clonal populations. Points represent individual single-nucleotide variants, and lines connect the median variant allele frequencies of each cluster. (B) Simplified view showing only subclones present in the primary tumor (left), the C7-T2 metastasis (center) and the T7-8 metastasis (right). (C) Nested view showing the origins of each subclone in the primary tumor (left), the C7-T2 metastasis (center) and the T7-8 metastasis (right).