
Figure 3.
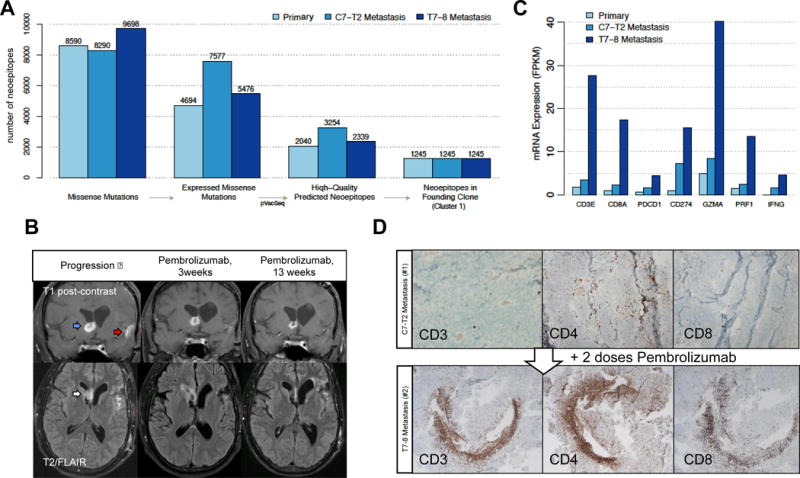
Predicted neoantigen burden and response to checkpoint blockade treatment. (A) Defining immunologically-relevant mutations through successive filtering steps, resulting in only expressed missense mutations that are present in every cell of the tumors and are predicted to create neoantigens. (B) Coronal T1 post-contrast (top) and axial T2/FLAIR (bottom) brain MRI sequences at progression (left panel), 3 weeks after Pembrolizumab initiation (middle panel), and 13 weeks after Pembrolizumab treatment (right panel). On post-contrast images, the right frontal enhancing lesion (blue arrow) decreases in intensity following Pembrolizumab. Enhancement near the site of initial resection (red arrow) disappears. On the T2/FLAIR sequence, the right frontal horn lesion (white arrow) increases in intensity and then decreases. (C) mRNA expression of key immune response-related genes. (D) Tumor-infiltrating lymphocytes following Pembrolizumab treatment. The glioblastoma metastatic specimens before (top panel) and after (bottom panel) Pembrolizumab were stained with antibodies to CD3, CD4, and CD8.