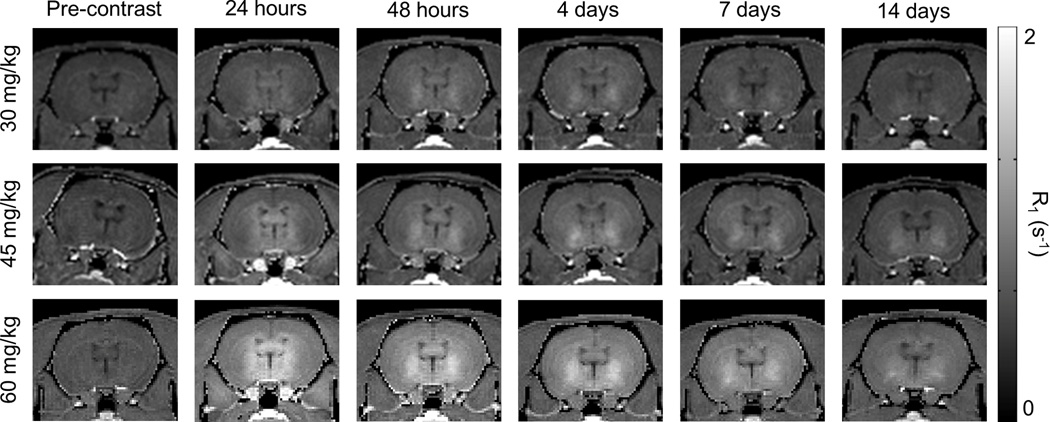
Figure 1.
Representative coronal R1 maps of three subjects delivered different doses of MnCl2 (30, 45, and 60 mg/kg). Imaging was performed and R1 maps were calculated prior to contrast administration and at five imaging time points over two weeks following administration. Higher contrast dose increases signal enhancement, particularly near the ventricles. Two weeks following contrast administration, signal enhancement remains, particularly in the vicinity of the striatum and globus pallidus.

