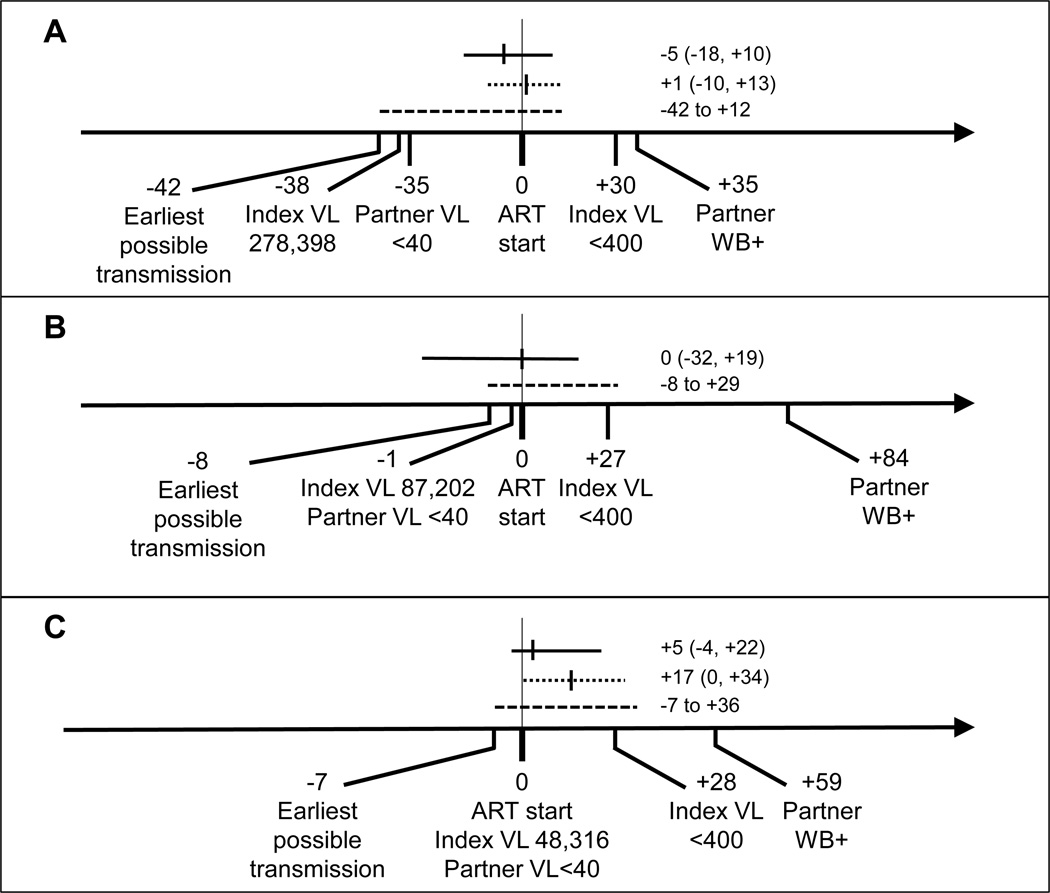
Figure 2. Analysis of the timing of linked partner infections that were diagnosed when the index participant was virally suppressed.
The figure shows data for three partner infections where the partner was diagnosed shortly after the index participant started antiretroviral therapy (ART), when the index was virally suppressed. The vertical line at Day 0 indicates the day of that the index participant started ART. Days before the start of ART are indicated with negative numbers; days after the start of ART are shown with positive numbers. Index and partner viral load (VL) values are indicated. The date of the partner’s first positive HIV test is indicated (WB+: Western blot positive). The solid horizontal lines indicate the estimated transmission date with 95% confidence intervals (CI) obtained using BEAST. Dotted lines indicate the estimated transmission date with 95% CI obtained using the Poisson Fitter. Dashed lines indicate the time between the earliest possible transmission date (7 days before the partner’s last test where HIV RNA was undetectable) and the end of the likely transmission period, determined by the Fiebig stage18 of the partner at the first HIV positive visit. (A) In Case A, the partner was diagnosed with HIV infection on Day +35. HIV RNA was undetectable (<40 copies/mL) on Day −35, indicating that the earliest possible transmission date was Day −42 (based on a 7-day eclipse period). The Western blot was positive on Day +35 (Fiebig stage V18), indicating that the transmission event occurred before Day +12. BEAST analysis estimated that the transmission event occurred on Day −5. Poisson fitter analysis estimated that the transmission event occurred on Day +1. (B) In Case B, the partner was diagnosed with HIV infection on Day +84. HIV RNA was undetectable on Day −1, indicating that the earliest possible transmission date was Day −8. The Western blot was positive on Day +84 (Fiebig stage VI18), indicating that the transmission event occurred before Day +29. BEAST analysis estimated that the transmission event occurred on Day 0. Poisson fitter analysis was not performed in this case because of the complexity of the partner’s viral population5. (C) In Case C, the partner was diagnosed with HIV infection on Day +59. HIV RNA was undetectable on Day 0, indicating that the earliest possible transmission date was Day −7. The Western blot was positive on Day +59 (Fiebig stage V18), indicating that the transmission event occurred before Day +36. BEAST analysis estimated that the transmission event occurred on Day +5. Poisson fitter analysis estimated that the transmission event occurred on Day +17.

