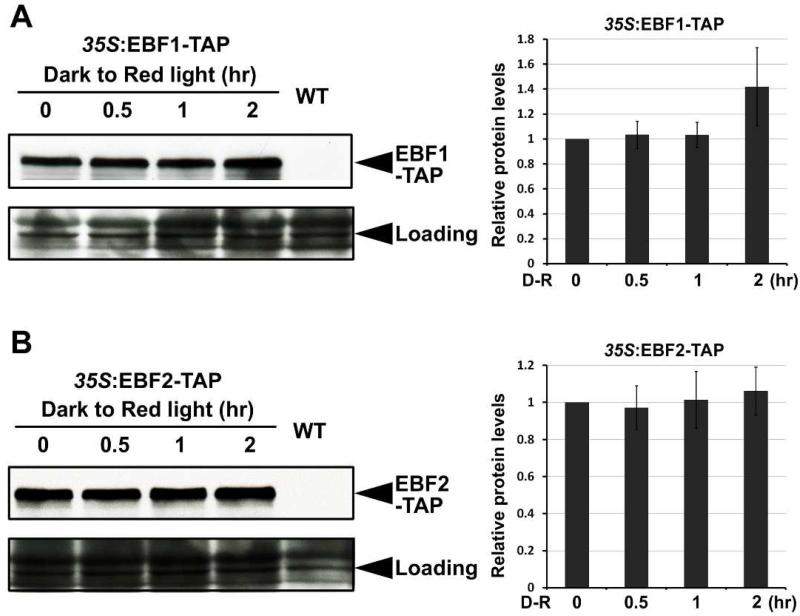
Figure 5. Light exposure does not significantly affect EBF1 and EBF2 protein levels in a short time during the dark-to-light transition.
Western blot results showing EBF1 (A) and EBF2 (B) protein levels during the dark-to-light transition. Four-day-old dark-grown WT and transgenic seedlings over-expressing EBF1-TAP or EBF2-TAP seedlings were exposed to red light for the indicated times. Right panels show the quantification analysis of EBF1 (A, right panel) or EBF2 (B, right panel) protein levels after normalization to RPT5. EBF1-TAP or EBF2-TAP protein levels before light irradiation were set as 1. Mean ± s.d., n=3. RPT5 was used as a loading control.

