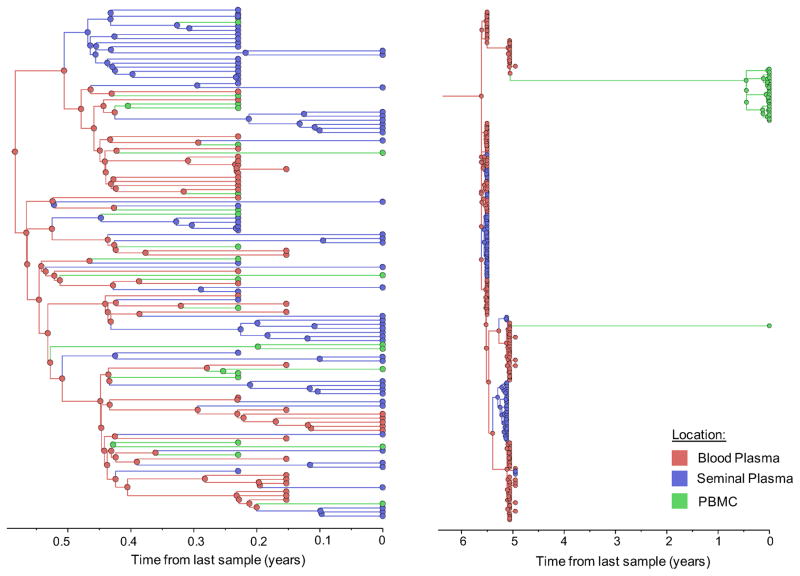
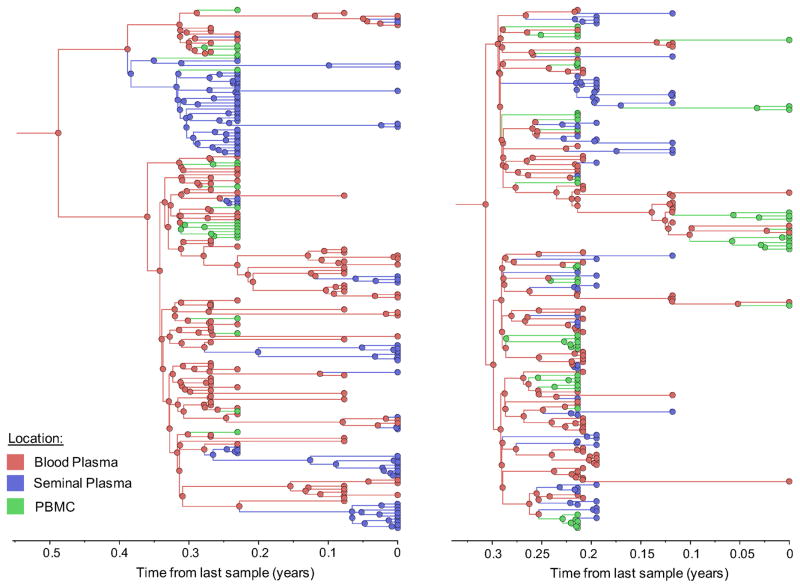
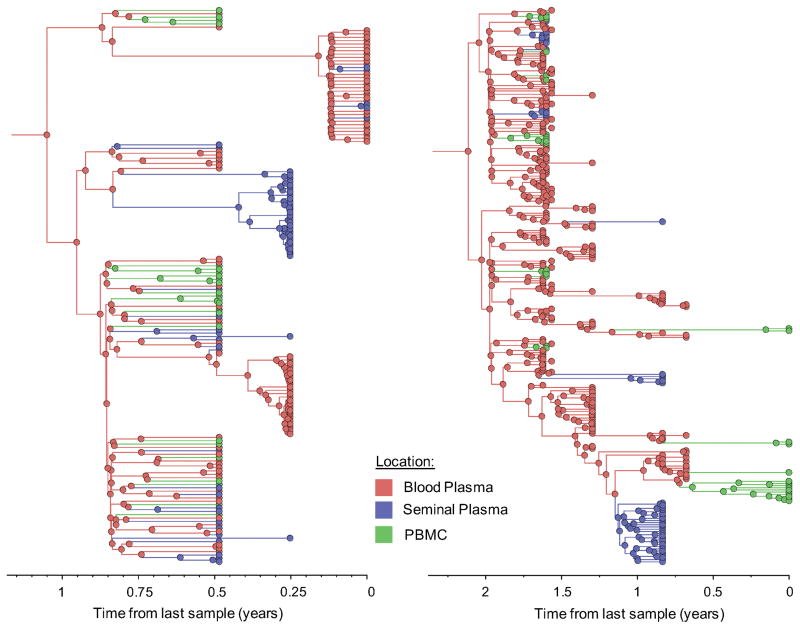
Figure 1. Time-scaled phylogeographic reconstruction of partial env sequences for the 6 individuals.
Branches and nodes are colored by the compartment of origin. HIV RNA sequences from blood plasma and seminal plasma, and HIV DNA sequences from PBMCs are depicted in red, blue and green respectively. These trees represent the inferred phylogenetic relationships of haplotype sequences. The x axis represents time in year before the latest sampling date (in year). Time scales of the trees were calibrated with the sampling dates available. A bayesian skyline tree prior was used as a coalescent demographic model under an uncorrelated lognormal (UCLN) molecular clock that allows rates to vary among the branches of the inferred phylogenies to infer the timescale of HIV evolution for each individual [40], with a gamma distribution prior. Analyses were made with BEAST v1.8.1 with BEAGLE [38, 39] (see Methods section).


