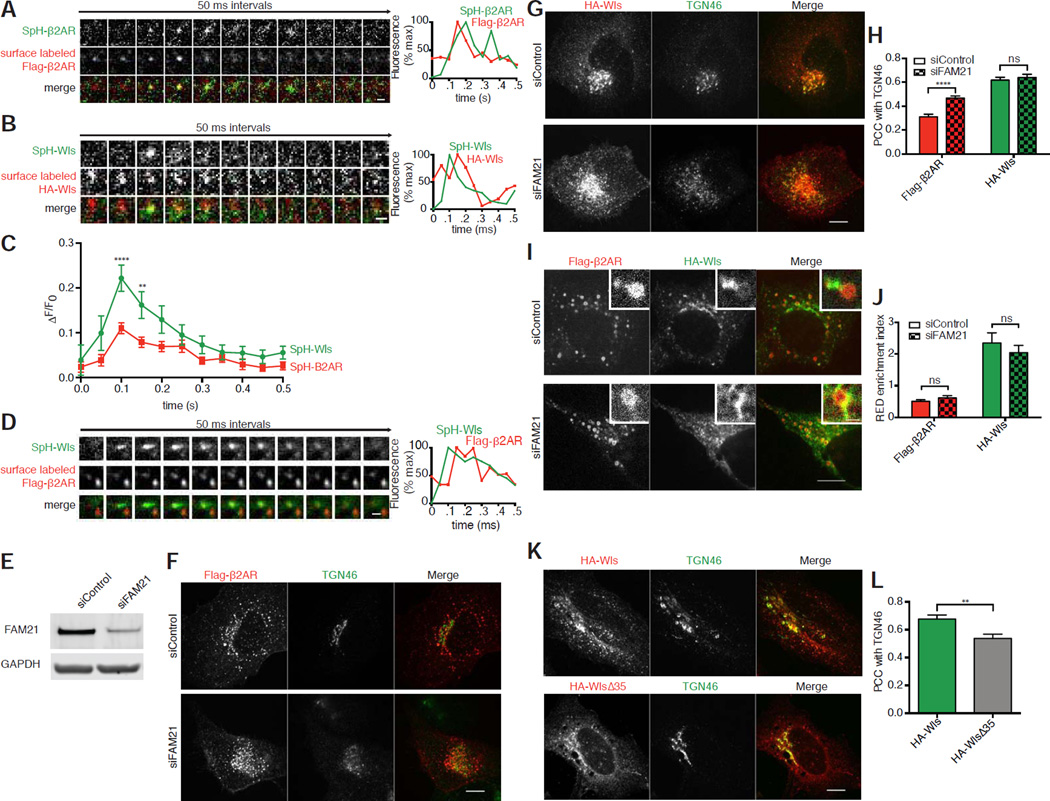
Figure 6. β2AR and Wls are each able to transit both the plasma membrane and the TGN.
(A) Left, representative TIR-FM image montage showing coincident plasma membrane insertion of Sph-B2AR and surface labeled Flag in a live HEK-293 expressing Flag-SpH-β2AR. Right, fluorescence traces showing that surface labeled Flag appears in the TIRF field prior to SpH insertion and that both signals rapidly diffuse. (B) Left, representative TIR-FM image montage showing coincident plasma membrane insertion of Sph-Wls and surface labeled HA in a live HEK-293 expressing HA-SpH-Wls. Right, fluorescence traces showing that surface labeled HA appears in the TIRF field prior to SpH insertion and that both signals rapidly diffuse. (C) Average ΔF/F0 plot of SpH signals of insertion events from cells expressing either SpH-Flag-β2AR or SpH-HA-Wls (n=10 events from two independent experiments). (D) Representative TIR-FM image montage showing coincident plasma membrane insertion of Sph and surface labeled Flag (arrows) in a live HEK-293 expressing both HA-SpH-Wls and Flag-β2AR. Right, fluorescence traces showing that surface labeled Flag appears in the TIRF field prior to SpH insertion and that both signals rapidly diffuse. (E) Representative immunoblots of cell lysates upon control or FAM21 siRNA knockdown blotted for FAM21 or GAPDH. Average percent knockdown upon treatment with FAM21 siRNA was quantified at 83.0±13.6% of control (mean ± standard deviation, n=3). (F) Representative confocal images of fixed HeLa cells expressing Flag-β2AR, treated with control or FAM21 siRNA, and surface labeled with anti-Flag antibody, chased for 60 minutes. (G) Representative confocal images of fixed HeLa cells expressing HA-Wls, treated with control or FAM21 siRNA, and surface labeled with anti-Flag antibody, chased for 60 minutes. (H) Accumulation of each cargo in the TGN upon control or FAM21 knockdown, quantified by average Pearson’s correlation coefficient with TGN46 after a 60-minute chase incubation (n=30 cells pooled from 3 independent experiments). (I) Representative confocal images of live HEK-293 cells treated with either control or FAM21 siRNA surface labeled for HA-Wls and Flag-β2AR after chase incubation. Inset images show representative endosomes with REDs at higher magnification. Inset scale bar,1 µm. (J) Average RED enrichment indices of Flag-β2AR and HA-Wls upon control or FAM21 knockdown (n=30 REDs pooled from 3 independent experiments). (K) Representative confocal images of permeabilized HeLa cells expressing either HA-Wls or HA-WlsΔ35 showing steady state localization relative to TGN46. (L) Average Pearson’s correlation coefficient of HA-Wls and HA-WlsΔ35 with TGN46 at steady state (n=20 cells pooled from 2 independent experiments). Large image scale bars; 10 µm. TIR-FM montage scale bars, 1 µm. Error bars correspond to s.e.m.

