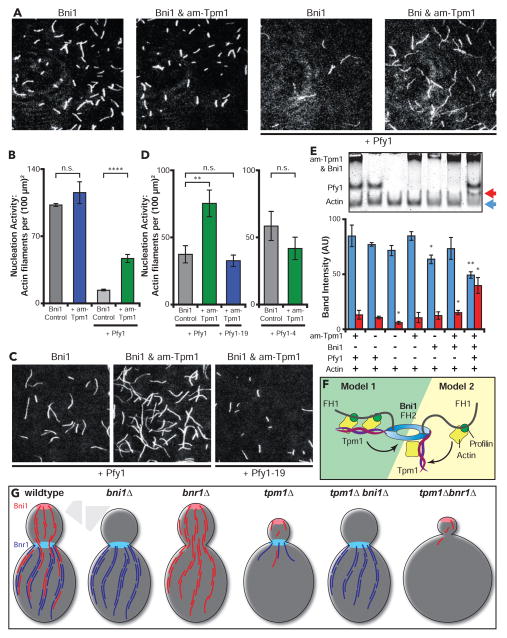
Figure 4. Tpm1 stimulation of Bni1-mediated actin nucleation requires profilin and its interactions with G-actin and formins.
(A) Representative FOVs from TIRF reactions containing 1.0 μM monomeric actin (20% Oregon Green-labeled) polymerized in the presence of 250 pM Bni1 and variable components: 3.0 μM yeast profilin and 2.5 μM am-Tpm1. Scale bar, 20 μm. (B) Actin nucleation effects determined from the reactions in A. Number of filaments per FOV was quantified as in Figure 3A from two independent experiments (12 FOV per condition). (C) Representative FOVs from TIRF reactions; conditions as in A, except using 3 μM Pfy1 and Pfy1-19 as indicated. Scale bar, 20 μm. (D) Actin nucleation effects determined by TIRF microscopy; conditions as in A, except using 3 μM Pfy1, Pfy1-4, or Pfy1-19 as indicated. The number of filaments per FOV was quantified as in Figure 3A from ≥ 2 separate experiments (≥ 12 FOVs per condition). (E) Native gel shift analysis of G-actin. Reactions contained 1.0 μM latrunculin bound G-actin with one or more variable components: 0.5 μM Bni1, 5.0 μM am-Tpm1, and 3 μM yeast profilin (Pfy1). Reactions fractionated by native PAGE, stained with Coomassie Blue and actin band intensity was quantified at the unshifted (blue arrow) and shifted (red arrow) positions. Data averaged from three independent experiments (blue and red bars, as above). Significant differences are compared to actin & profilin control (Lane 2). (F) Two possible models for how Tpm1 and profilin works together to enhance Bni1-mediated actin filament nucleation. (G) Graphical summary of actin cable pheontypes in indicated strains studied. Error bars, SEM. Student’s T-test used to determine significant differences: n.s. – not significant, * < 0.05, ** < 0.01, **** < 0.0001. See also Figure S3 and Movies S3, S4, and S5.

