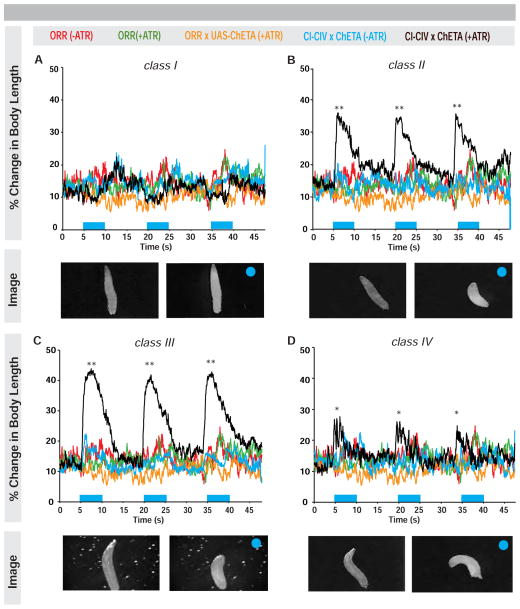
Figure 3. Optogenetic activation of class II and III neurons results in contract response.
(Average percent change in body length over time upon light exposure (blue bars) and optogenetic activation (black) of (A) CI (B) CII (C) CIII or (D) CIV neurons. Larvae not fed (red) or fed (green) ATR, larvae bearing the UAS-channelrhodopsin transgene (ChETA) alone (orange), or larvae expressing ChETA but not fed ATR (blue) acted as negative controls. Bottom inserts: larval images of optogenetic activation for each class pre- and post-light (blue circle) exposure. * = p < 0.05, ** = p < 0.01, n = 15–20. See also Figure S3 and Movie S5.

