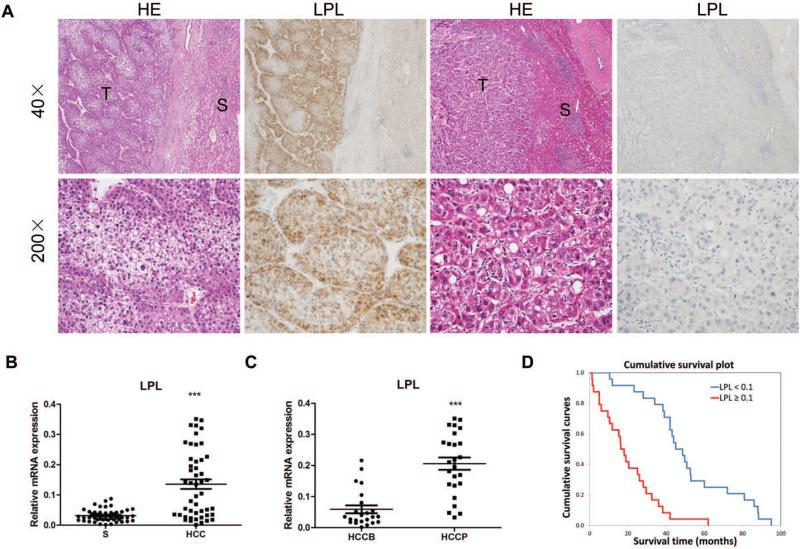
Figure 1.
Expression patterns of LPL in human HCC. (A) Immunohistochemical patterns of LPL. Left panel, HCC (T) showing upregulation of LPL when compared to the non-neoplastic counterpart (S). Right panel, equivalent immunoreactivity for LPL protein in an HCC and corresponding surrounding non-tumorous liver. Original magnification: 40X in upper panel; 200X in lower panel. Abbreviation: HE, hematoxylin and eosin staining. (B) qRT-PCR analysis of LPL mRNA expression in 48 paired human HCC and non-tumor liver tissues (S). (C) LPL mRNA levels in HCCP (n=25) and HCCB (n=23). The ΔCt value of each sample was calculated by subtracting the average Ct value of the LPL gene from the average Ct value of the β- Actin or RNR-18 gene. (D) Kaplan–Meier survival analysis of HCC patients with high and low expression of LPL. Tukey-Kramer's test: ***P < 0.001.

