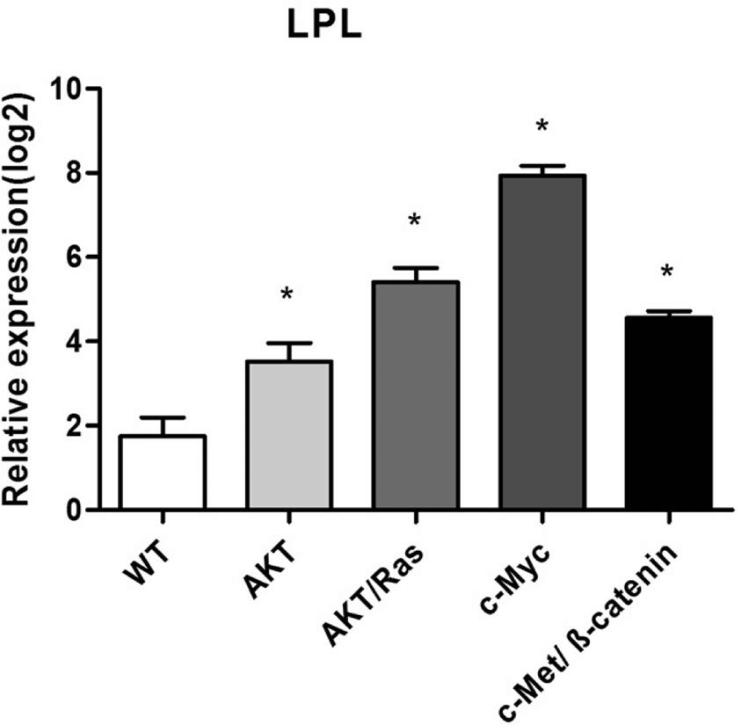
Figure 2.
Expression levels of LPL in wild-type (WT) and tumor samples from different HCC mouse models (overexpressing AKT/Ras, c-Myc, or c-Met/β-catenin). Data were obtained by qRT-PCR and normalized to 18S rRNA gene (n=5 in each group). The ΔCt value of each sample was calculated by subtracting the average Ct value of the target gene from the average Ct value of the 18S rRNA gene. Tukey-Kramer's test: * P < 0.05.

