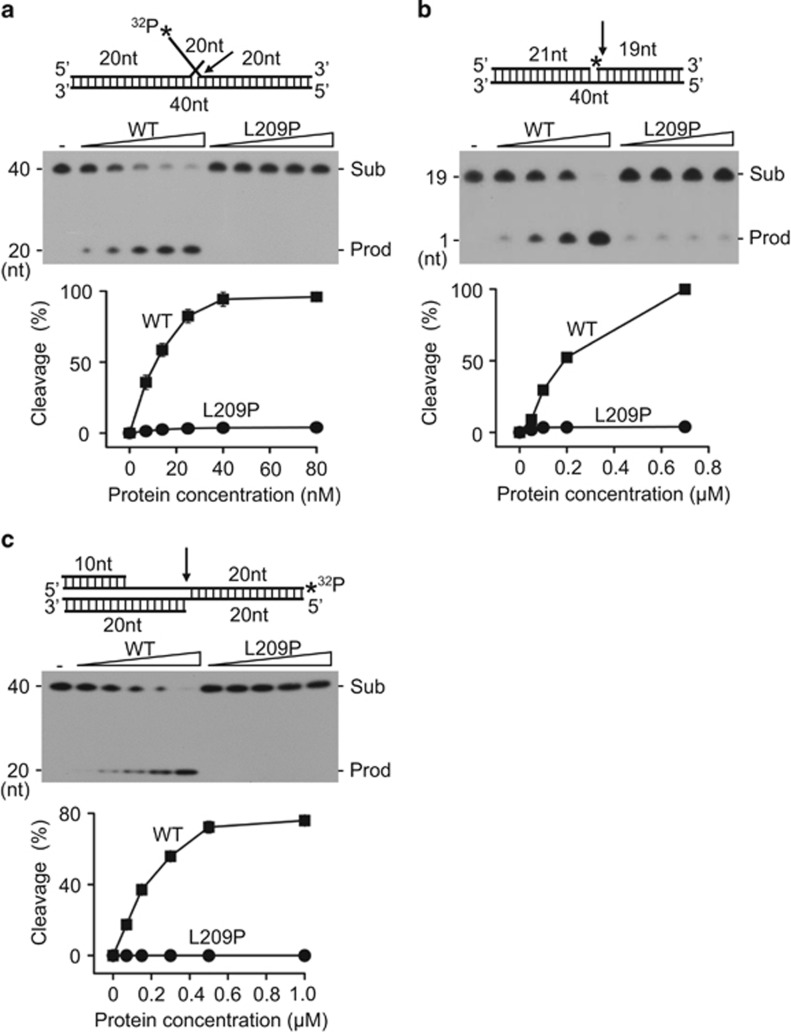
Figure 2.
Activities of WT and mutant FEN1 on double-flap, nick and gap substrates. Labeled substrates (1 pmol) were incubated with various amounts of purified WT or L209P FEN1 at 37 °C for 30 min. (a) FEN activity on a 5′-labeled double-flap substrate. The FEN1 concentration is 0–80 nM. (b) EXO activity on a 5′-labeled nick substrate. The FEN1 concentration is 0–0.8 μm. (c) GEN activity on a 3′-labeled gap substrate. The FEN1 concentration is 0–1.0 μm. The top panel shows the schematic structure of the corresponding DNA substrates. The middle panel shows the PAGE gel separating the DNA substrates (Sub) and the cleavage products (Prod). The graph on the bottom represents the quantification of the PAGE image. Arrows indicate the cleavage site of DNA by FEN1 and asterisks indicate the position of DNA labeled by 32P.

