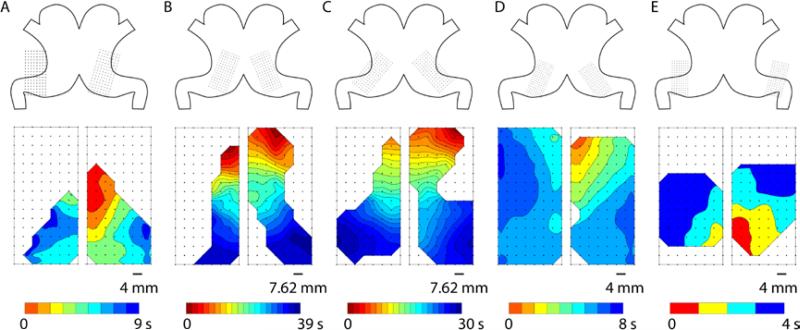
Figure 2.
Example activation times maps of canine gastric slow waves in five subjects (A-E). Top: The orientations and positions of the electrode arrays illustrate the coverage of the mapping fields in each subject. Bottom: Activation times map of a typical cycle of gastric slow waves from each subject, showing approximately simultaneous and antegrade propagation towards the pylorus. Note the larger arrays were used in 2 (B) and 3 (C), resulting in a substantially longer overall activation period (~35 s) and more closely-spaced isochrones (1 s interval in all activation times maps).

