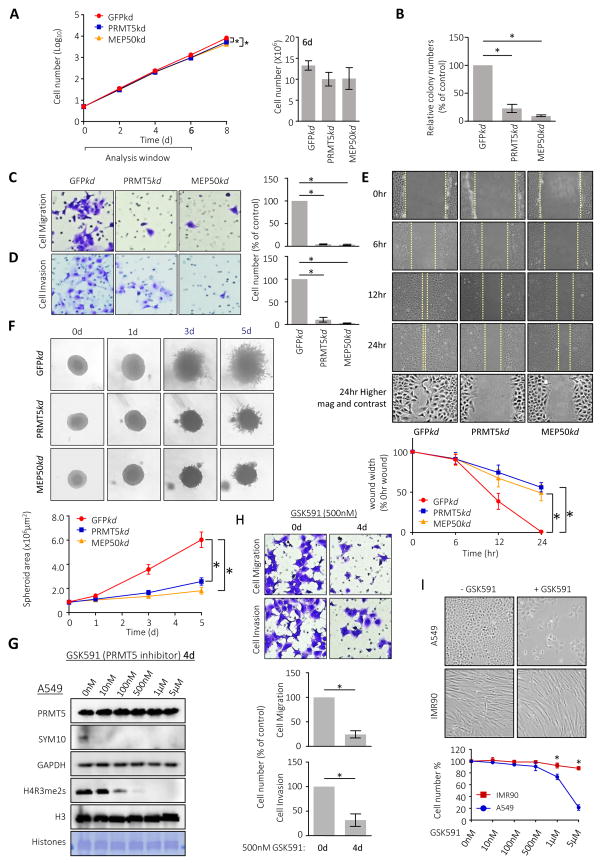
Figure 3. PRMT5-MEP50 knockdown prevents cancer cell invasion.
A. Proliferation of A549 cells expressing shRNA targeted against GFP (red circle; GFPkd), PRMT5 (blue square; PRMT5kd) and MEP50 (orange triangle; MEP50kd). Plotted data are mean ± S.E.M. of three independent experiments. *p < 0.05 from one-way ANOVA test. Histogram (right): cell count on 6th day for each sample.
B. Colony formation assays of A549 cells expressing shRNAs are quantified for relative colony numbers (% of control). +Values are means ± S.E.M. of three independent experiments. *p < 0.05 from one-way ANOVA test.
C. Migration through 8 μm pores by GFPkd, PRMT5kd or MEP50kd A549 cells was measured. Left: representative crystal violet staining of migrated cells on the underside of the porous polycarbonate membrane under a phase-contrast microscope (20X). Right: quantification of the migrated cells. Values are mean ± S.E.M. of three independent experiments. *p < 0.05 from one-way ANOVA test.
D. Matrigel invasion through 8 μm pores by GFPkd, PRMT5kd or MEP50kd A549 cells was measured. Left: representative crystal violet staining of invaded cells on the underside of the porous polycarbonate membrane under a phase-contrast microscope (20X). Right: quantification of invaded cells. Values are mean ± S.E.M. of three independent experiments. *p < 0.05 from one-way ANOVA test.
E. Rate of wound-healing of GFPkd, PRMT5kd or MEP50kd A549 cells was measured over 24 hours. Top: phase-contrast pictures (10X) of each cell line after scratching the confluent cells with the leading edge of cells indicated by a dashed yellow line. Bottom: quantification of the wound width (% 0hr wound width) after the scratch in indicated time points. Values are means ± S.E.M. of three independent experiments. *p < 0.05 from one-way ANOVA test.
F. 3D spheroid cell invasion assay of GFPkd, PRMT5kd or MEP50kd A549 cells. Cells were aggregated into spheroids and then induced to invade the invasion matrix for the indicated time courses. The flat area of the cell mass view was calculated at four time points to measure cell invasion rate. Top: representative spheroid images for individual A549 cell lines under a phase-contrast microscope (20X). Bottom: histogram depicting the Spheroid area (×106 μm2) measured with ImageJ 1.49. Values are means ± S.E.M. of three independent experiments. *p < 0.05 from one-way ANOVA test.
G. A549 cells were treated with 0, 10nM, 100nM, 500nM, 1μM, or 5μM GS591 for 4 days and lysates or extracted histones were blotted for PRMT5, SYM10 (methylated SmD3), GAPDH (control), H4R3me2s, and H3 as indicated. DB71 stain of extracted histones is also shown.
H. Invasivity of A549 cells treated with 500nM GSK591 for 0 or 4 days were measured in a Matrigel assay. Top: Representative crystal violet staining of invaded cells on the underside of the porous polycarbonate membrane through a phase-contrast microscope (20X) are shown. Bottom: Quantification of the invaded cells. Values are mean ± S.E.M. of three independent experiments. *p < 0.05 from one-way ANOVA test.
I. Morphology (top micrographs) and viability (bottom plot) of A549 or IMR90 cells treated with 5 μM GSK591 for 4 days. Values are mean ± S.E.M. of three independent experiments. *p < 0.05 from one-way ANOVA test.

