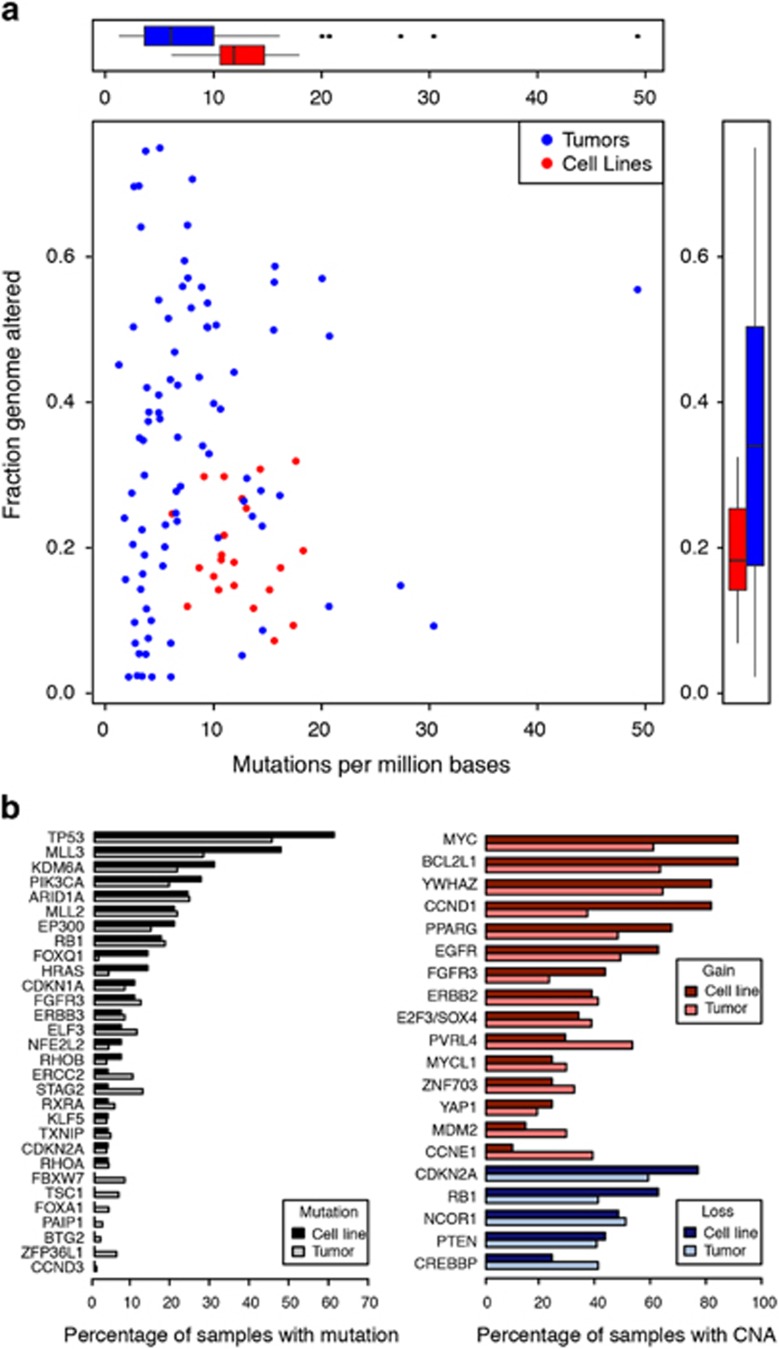
Figure 7.
Genomic comparison of BCa cell lines to tumors. (a) Mutation frequency (x axis) compared with the fraction of the genome altered (y axis) for bladder tumors (blue) and cell lines (red). (b) Frequently altered genes identified from the TCGA analysis of BCa tumors4 are ordered by the percentage of samples with mutations in TCGA tumors as compared with the cell lines. Amplified, red; deleted, blue.

