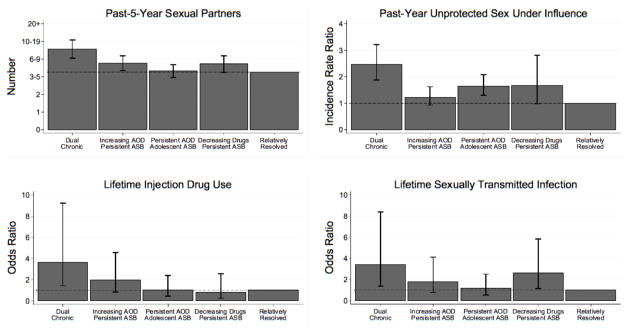
Figure 2.
Mean, incidence rate ratio, and odds ratios of sexual risk behaviors by trajectory class membership
Note. Analyses were adjusted for age, sex, and race/ethnicity. The relatively resolved trajectory class was set as the referent class. The error bars indicate the 95% confidence intervals for comparisons between trajectory classes 1–4 with the referent class. Additional pairwise comparisons are not illustrated in these figures.

