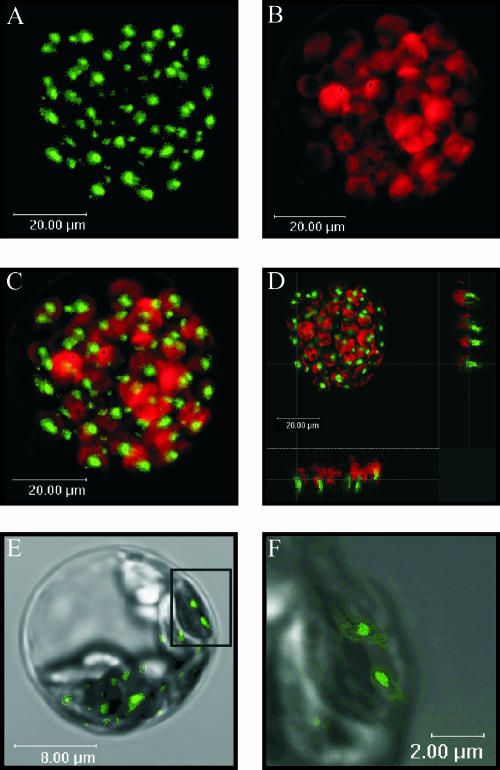
Figure 5.
Detailed analysis of the subcellular localization of AtStr15. Arabidopsis protoplasts were transformed with the AtStr15/pGFP-N fusion construct. All images (A–F) were made with the True Confocal Scanner. GFP fluorescence was excited with an argon laser (488 nm) and detected at 515 nm to 520 nm. Chlorophyll autofluorescence (red) was detected simultaneously at 650 nm to 670 nm. A, GFP fluorescence in a transformed protoplast. B, chlorophyll fluorescence of the same protoplast as in A. C, Merged image of A and B. D, This figure represents the image shown in C having coordinating lines to show the localization of AtStr15 (shown on the sidelines). E, GFP fluorescence of a single chloroplast merged with the respective bright field image. F, Enlarged image of the inset of Figure E. The sizes of the scale bars are given directly in the images.

