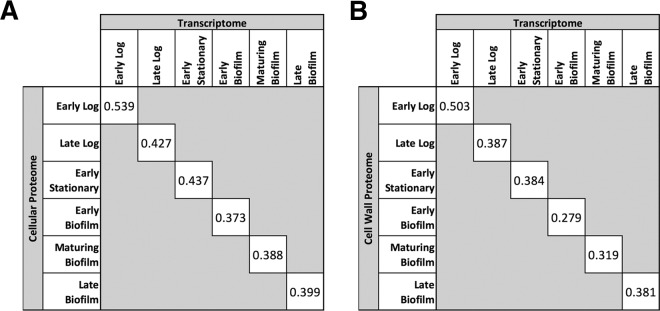
FIG 5 .
Correlation between transcriptome and proteome. Expression values within each time point were normalized by z-scoring, and the Pearson correlation coefficient was calculated for all genes with corresponding proteins identified in either the cellular proteome (A) or the cell wall proteome (B). The graphical representation of the full correlation between the indicated time points is available in the supplemental material.

