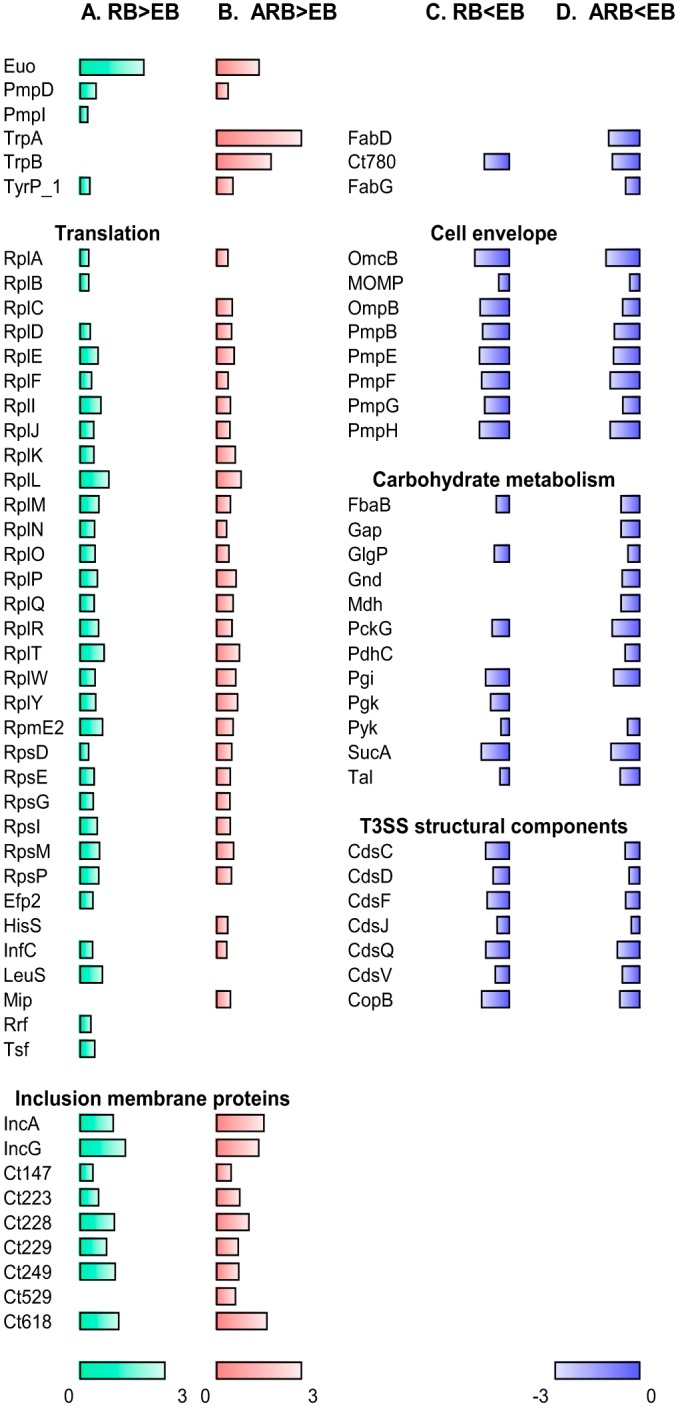
Fig. 5.

Overview of selected proteins that display changed abundance (fold change >2, p < 0.05). A, Proteins with increased abundance in the RB form compared with the EB form, B, increased abundance in the ARB form compared with the EB form, C, decreased abundance in RB compared with EB, D, and decreased abundance in ARB compared with EB. The bars depict the log10 transformed fold change values; the green bars represent RB/EB abundance ratio values between 0 and 3, the red bars ARB/EB ratio values between 0 and 3, and the blue bars RB/EB or ARB/EB ratio values between −3 and 0. Bars are only shown for proteins with changed abundance. The complete data set is listed in Supplemental Table 2.
