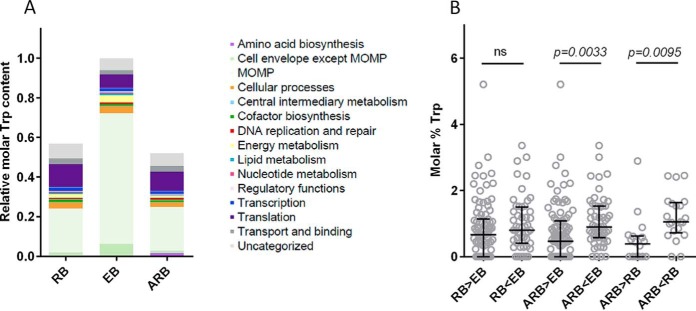
Fig. 6.
The Trp content in the RB, EB and ARB growth forms. A, The distribution of Trp among proteins grouped into different functional categories for each growth form; the total amount of tryptophan in the EB form was set to 1. The molar equivalents of the mean Trp content was calculated based on the iBAQ values for each of the biological replicates. MOMP belongs to the cell envelope but is here shown separately. B, Trp content in proteins which display changed abundance, the median values are shown. The comparison was performed by the Kruskal-Wallis test with Dunn's post test, and the comparisons were either nonsignificant (ns), or significant with the p values indicated.

