Fig. 2.
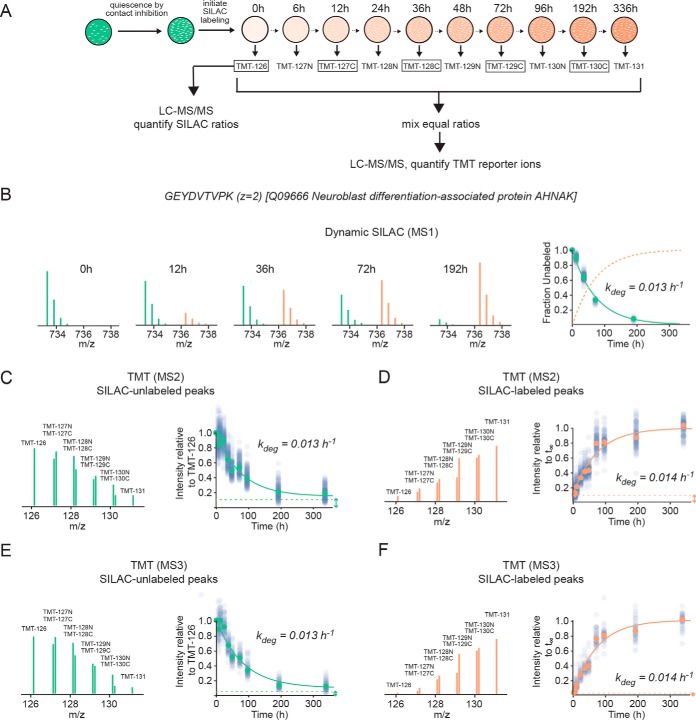
TMT-SILAC hyperplexing experimental design and sample data. A, Experimental design. HCA2-hTert cells were grown to confluency and SILAC labeling was conducted over the course of 336 h as cells were in a contact-inhibited quiescent state. Extracts were collected from 10 time-points and, following trypsinization, each was labeled with a different TMT tag. The TMT-tagged peptides were combined in a single multiplexed sample and analyzed by LC-MS/MS as described under Experimental Procedures. Additionally, a number of TMT-tagged time-points (boxed) were individually analyzed by LC-MS/MS without multiplexing using a standard dynamic SILAC approach. B, The fractional labeling of a tryptic peptide ion (GEYDVTVPK, z = 2) belonging to neuroblast differentiation-associated protein analyzed at the MS1 level by dynamic SILAC. The green and orange peaks indicate the relative intensities of unlabeled and labeled peptides, respectively. The plot indicates the decay curve for the fractional labeling of the unlabeled peaks for GEYDVTVPK (green circles) and all other peptides mapped to the protein (transparent blue circles). The green line indicates a fit to a single exponential equation. The fractional labeling of labeled peaks (calculated as one minus the fractional labeling of unlabeled peaks) is indicted by a dotted orange line. C, The kinetics for clearance of GEYDVTVPK analyzed at the MS2 level by TMT-SILAC hyperplexing. The MS2 spectrum indicates the relative intensities of TMT reporter ions for the SILAC-unlabeled peptide ion. The plot indicates intensities of peaks relative to the t0 sample (TMT-126) for GEYDVTVPK (green circles) and all other peptides mapped to the protein (transparent blue circles). The green line indicates a fit to a single exponential equation with a non-zero baseline indicated by a dashed line and double-headed arrow. D, The kinetics for appearance of GEYDVTVPK analyzed at the MS2 level by TMT-SILAC hyperplexing. The MS2 spectrum indicates the relative intensities of TMT reporter ions for the SILAC-labeled peptide ion. The plot indicates intensities of peaks relative to the fitted intensity of the exponential curve (orange line) at infinite time (t∞). The dashed line indicates the intensity of the t0 sample (TMT-126) and represents the initial baseline of the curve. E and F, Data analyzed as in C and D, respectively, except at the MS3 level using SPS-MS3.

