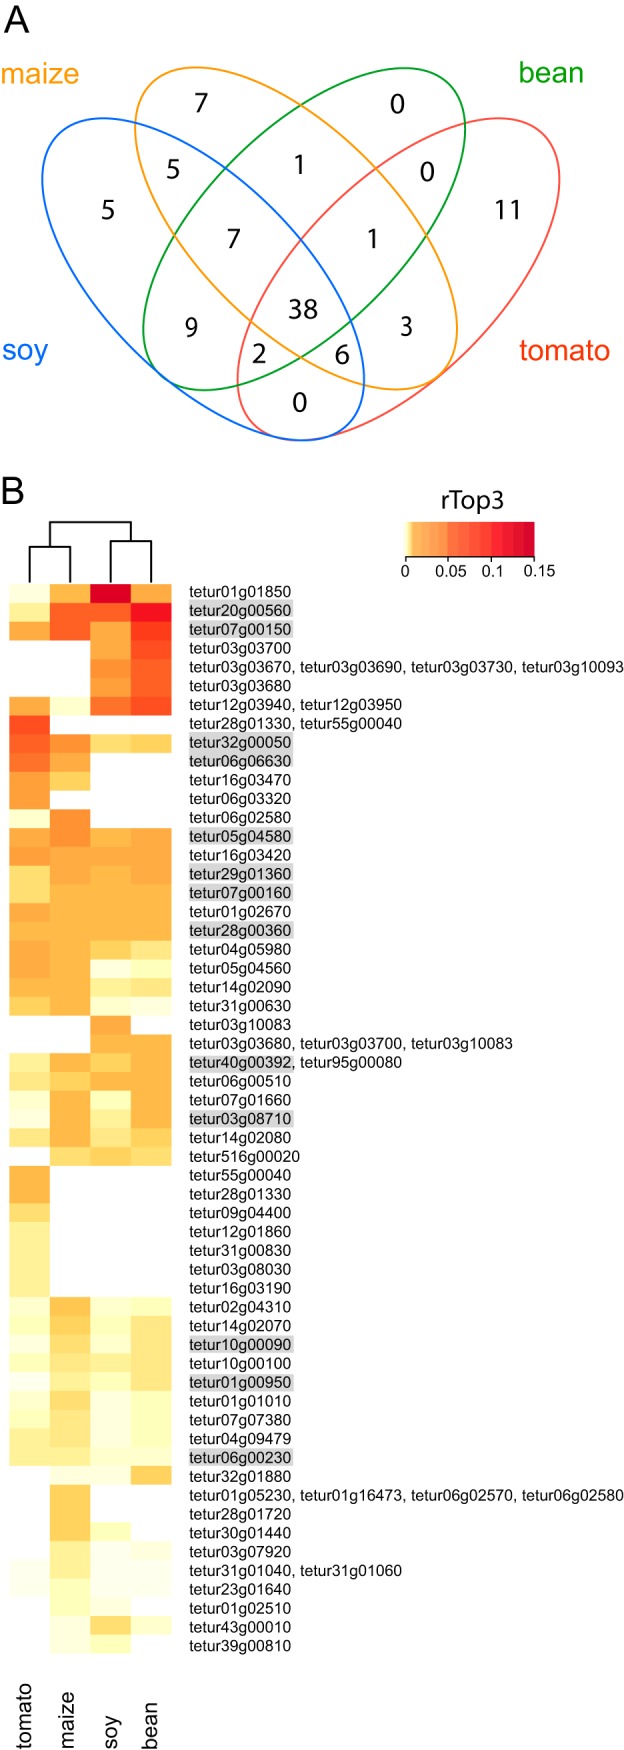
Fig. 4.

Overview of nano-LC-MS/MS identified putative T. urticae salivary proteins. A, Venn diagram depicting overlap between putative T. urticae salivary proteins secreted by mites adapted to different host plants (bean, maize, soy, tomato). Only those salivary proteins with a mean PSM of at least two in at least one of the T. urticae host plant adapted lines were used for comparison (see Table I and supplemental Table S6). B, Heat map of mean rTop3 values of putative T. urticae salivary proteins secreted by mites adapted to different host plants (bean, maize, soy, tomato). Only those salivary proteins (and “protein inference groups”) with a mean PSM of at least two in at least one of the T. urticae host plant adapted lines and with a maximum rTop3 value higher than the 30th percentile of maximum rTop3 values were used for comparison (see Table I and supplemental Table S6). The Euclidean distance metric and Ward's method were used for clustering of both rows and columns. All putative salivary proteins for which the corresponding genes were shown to be expressed in the salivary glands by ISH (Fig. 3) are shaded gray.
