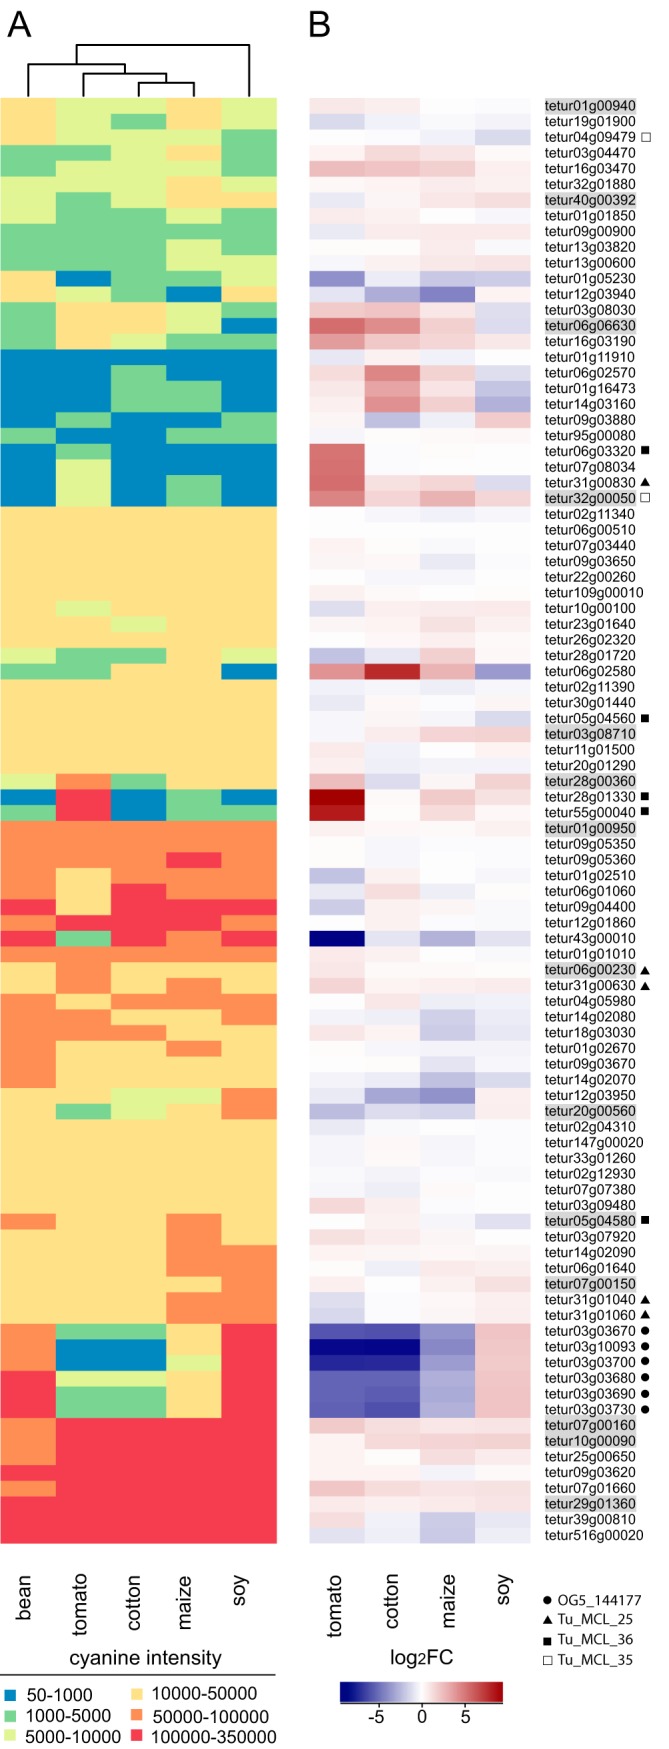
Fig. 5.

Heatmap of expression levels of putative T. urticae salivary protein encoding genes and their up- or down-regulation in mites adapted to different host plants. A, Heatmap of cyanine intensities of putative T. urticae salivary protein encoding genes. The Euclidean distance metric and Ward's method were used for clustering of both rows and columns. For 92 out of 95 putative T. urticae salivary protein genes expression data was available. B, Heatmap of log2FCs of putative salivary protein genes in mites adapted to soy, maize, cotton or tomato as compared with mites adapted to bean. Genes are sorted based on their order in panel A. Genes that were shown to be expressed in the salivary glands by ISH (Fig. 3) are shaded gray. A circle, triangle, filled square or empty square indicates whether a T. urticae gene belongs to either OrthoMCL group OG5_144177, Tu_MCL_25, Tu_MCL_36 or Tu_MCL_35, respectively.
