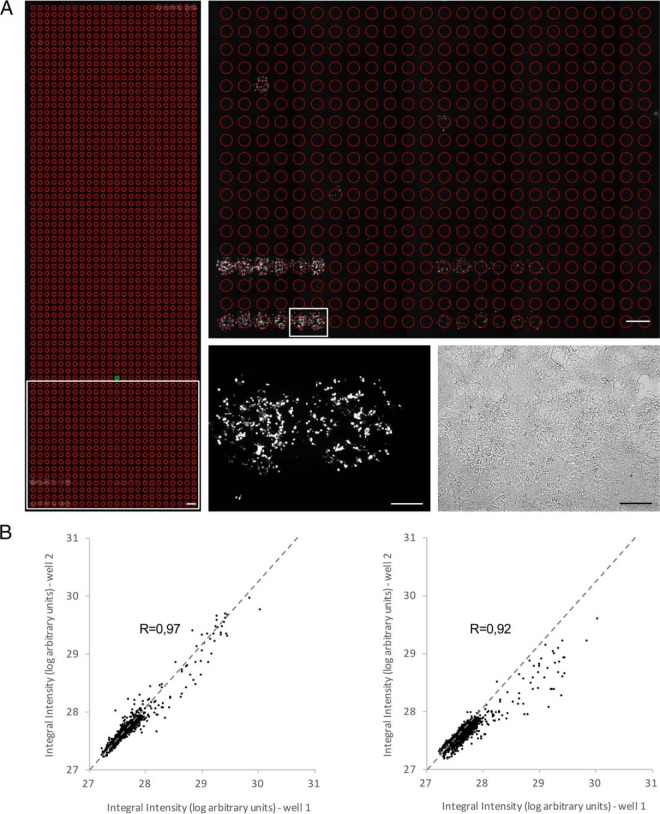
Fig. 2.
Quality and performance of the cell microarray screening approach. A, Microscopic image of a microarray sample. Left panel: example of the imaging output of a whole well containing 1728 spots screened with the GR bait and stimulated with leptin. The individual regions of interest (ROI) for which the fluorescence signal is measured are indicated as red circles. Constitutive positive controls are present at the lower left (2 series of 6 replicates) and upper right (1 series of 6 replicates). Scale bar: 1 mm. Upper right panel: magnification of the region indicated by the white rectangle in the lower left panel. Scale bar: 1 mm. Lower right panels: fluorescence (left) and bright field (right) image of the area indicated by the white rectangle in the upper right panel. Individual spots are covered by ∼500 cells. Scale bar: 250 μm. B, Dot plot showing the correlation between technical and biological replicates of a microarray well. The integral fluorescence intensity of the 1728 spots from a well corresponding to a microarray plate screened with the DHFR anchor bait and stimulated with leptin was compared with the fluorescence signal of the spots from a replicate well in the same (within screen variation, left panel) or a separate independent (between screen variation, right panel) screen that had been similarly stimulated. Pearson's correlation coefficient (R) is indicated. See supplemental Table S1 for raw data.

