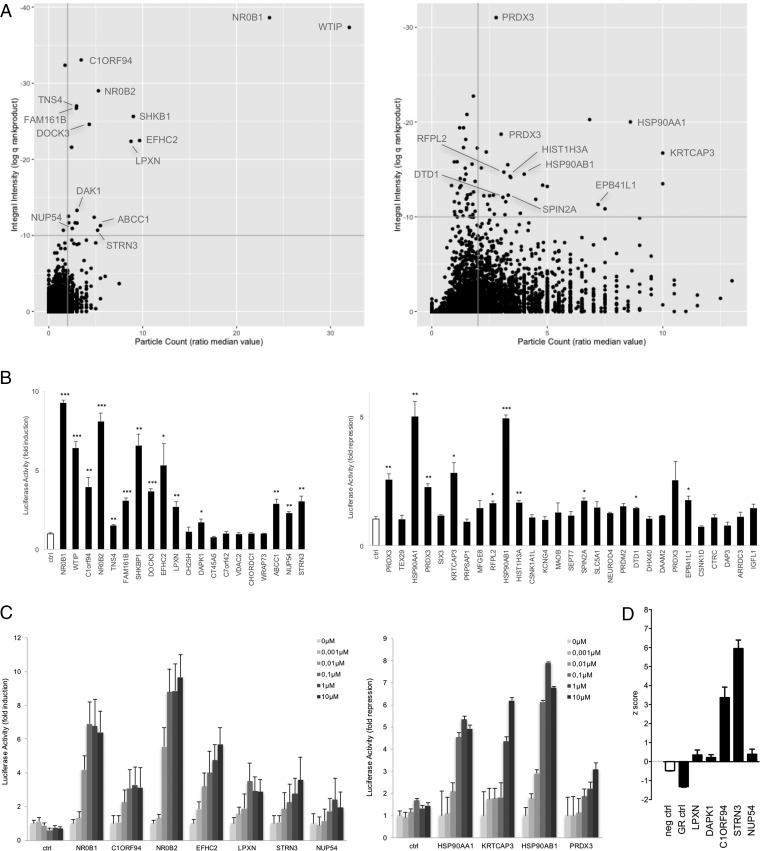
Fig. 4.
Identification of dexamethasone-modulated interactions with GR in a MAPPIT cell microarray screen. A, The ORF prey collection was screened with the GR bait, with quadruplicate samples of both cell treatments: leptin and 1 μm dexamethasone costimulated and leptin only stimulated. Data was analyzed as described in Fig. 3A for up- (left panel) and downregulated signals (right panel), the upper right quadrant containing the candidate hits (20 up- and 29 downregulated candidates). Interacting proteins, the modulated binding to GR of which was confirmed in MAPPIT confirmation experiments (Fig. 4B), are indicated. See supplemental Table S3 for raw data. B, ORF preys selected upon application of the preset thresholds (q<10−10; ratio median value particle count>2) were re-evaluated for dexamethasone-modulated binding in MAPPIT. Cells coexpressing the GR bait and the indicated ORF preys were stimulated with leptin alone or leptin combined with 1 μm dexamethasone. Three independent experiments were performed and the fold induction (for up-regulated GR binders; left panel) or fold repression (for downregulated GR binders; right panel) was calculated as the average luciferase activity of leptin+dexamethasone treated versus leptin only treated (for up-regulated GR binders) or leptin only treated versus leptin+dexamethasone treated (for downregulated GR binders) samples. Error bars represent S.E. An empty prey (unfused gp130) was taken along as a control and used to compare data with applying a two-tailed Student's t test (*: p < 0.05; **: p < 0.01; ***: p < 0.001). C, Dose-dependent modulation of the GR interaction of selected ORF preys was tested in MAPPIT. Cells coexpressing the GR bait and the indicated ORF preys were stimulated either with leptin alone or with leptin and dexamethasone in a concentration gradient from 0.001 to 10 μm. The bars indicate the fold induction (for up-regulated GR binders; left graph) or fold repression (for downregulated binders; right graph) as in B, calculated using the average of triplicate samples. Error bars represent S.D. D, Functional effect of silencing of selected GR interaction partners in A549 cells. A549 cells harboring the GRE-luc GR-responsive reporter were transfected with siRNA specific for the indicated proteins and treated either with vehicle or with 1 μm dexamethasone before measuring luciferase activity. Controls include a nontargeting siRNA (neg ctrl) and an siRNA for GR (GR ctrl). Each condition was performed in triplicate. The graph represents the z-score [(x-m)/S.D.)] of three independent experiments.

